
VibeInfra Cockpit
Choose an incident to practice. Investigate live telemetry, inspect container socket logs, modify Kubernetes manifests, and restore degraded production systems with automated verification.
See how you investigate under pressure.
No credit card · No local setup · 0 VibeCredits
Choose your mission path
Start Here
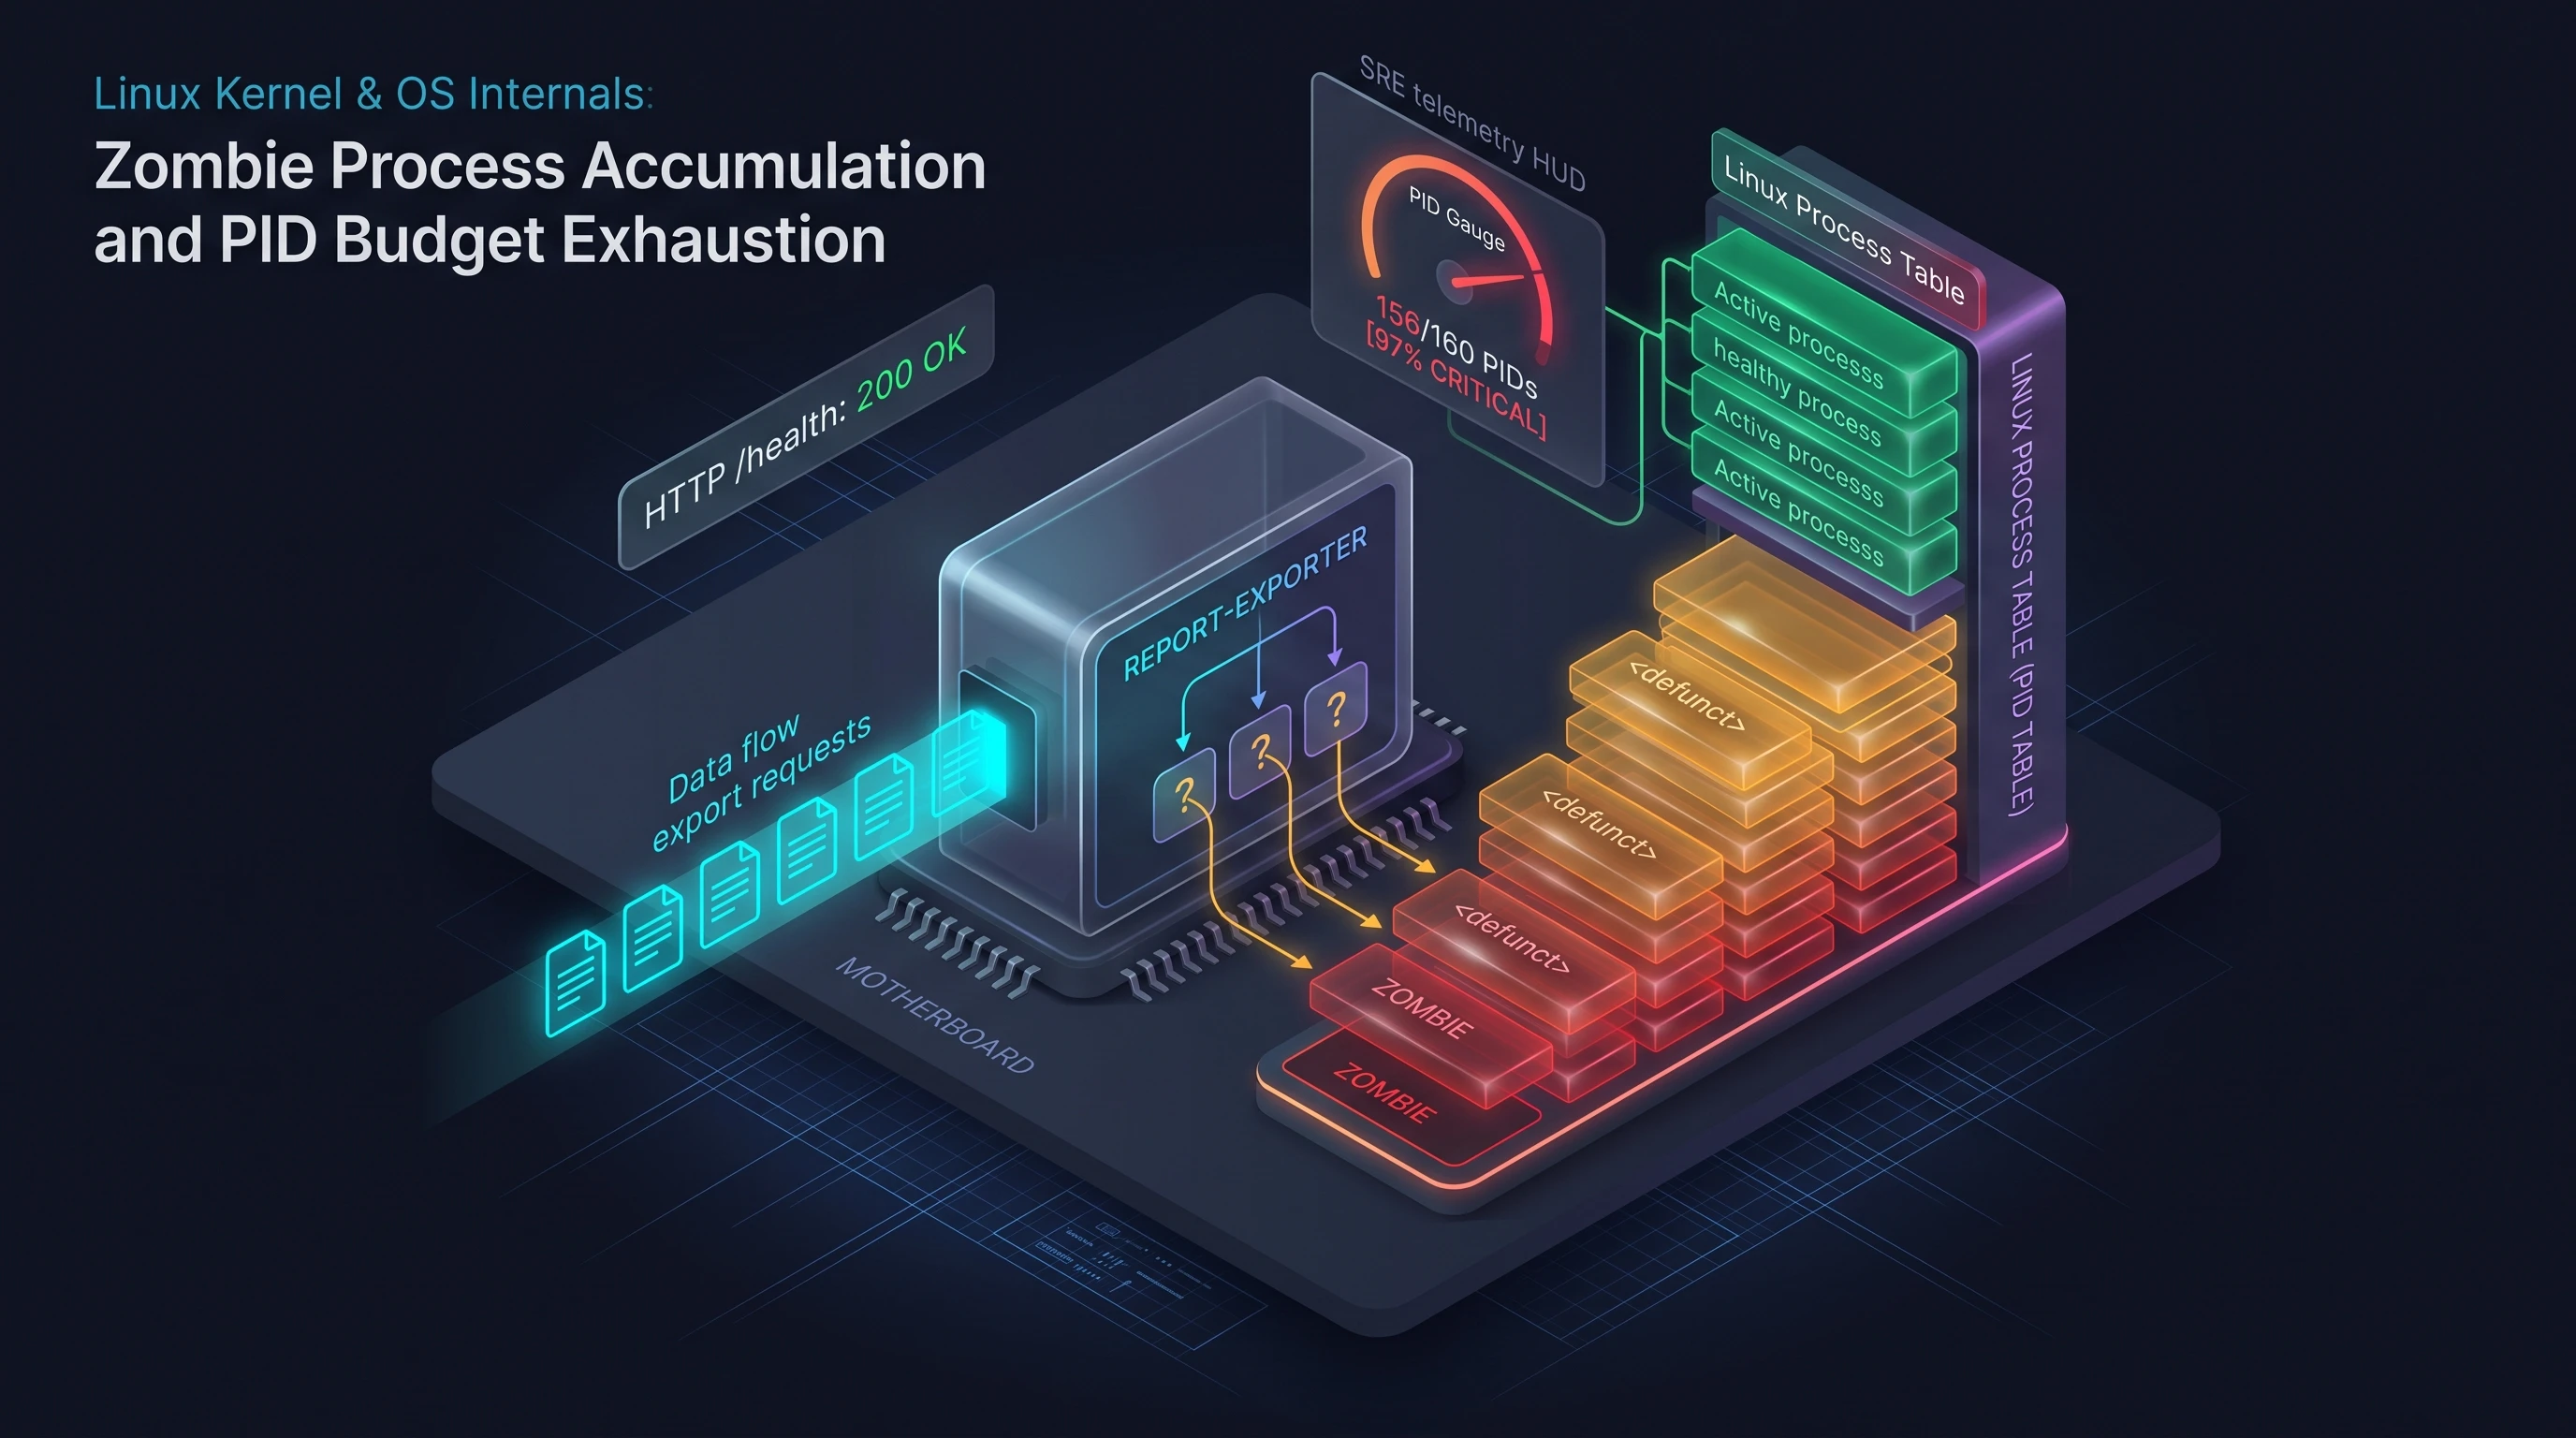
Incident #56 — Report Exports Fail After a Deployment
Report exports fail after a worker deployment while the HTTP health check stays green. Trace real gzip child processes, identify PID exhaustion, and safely roll back the release.
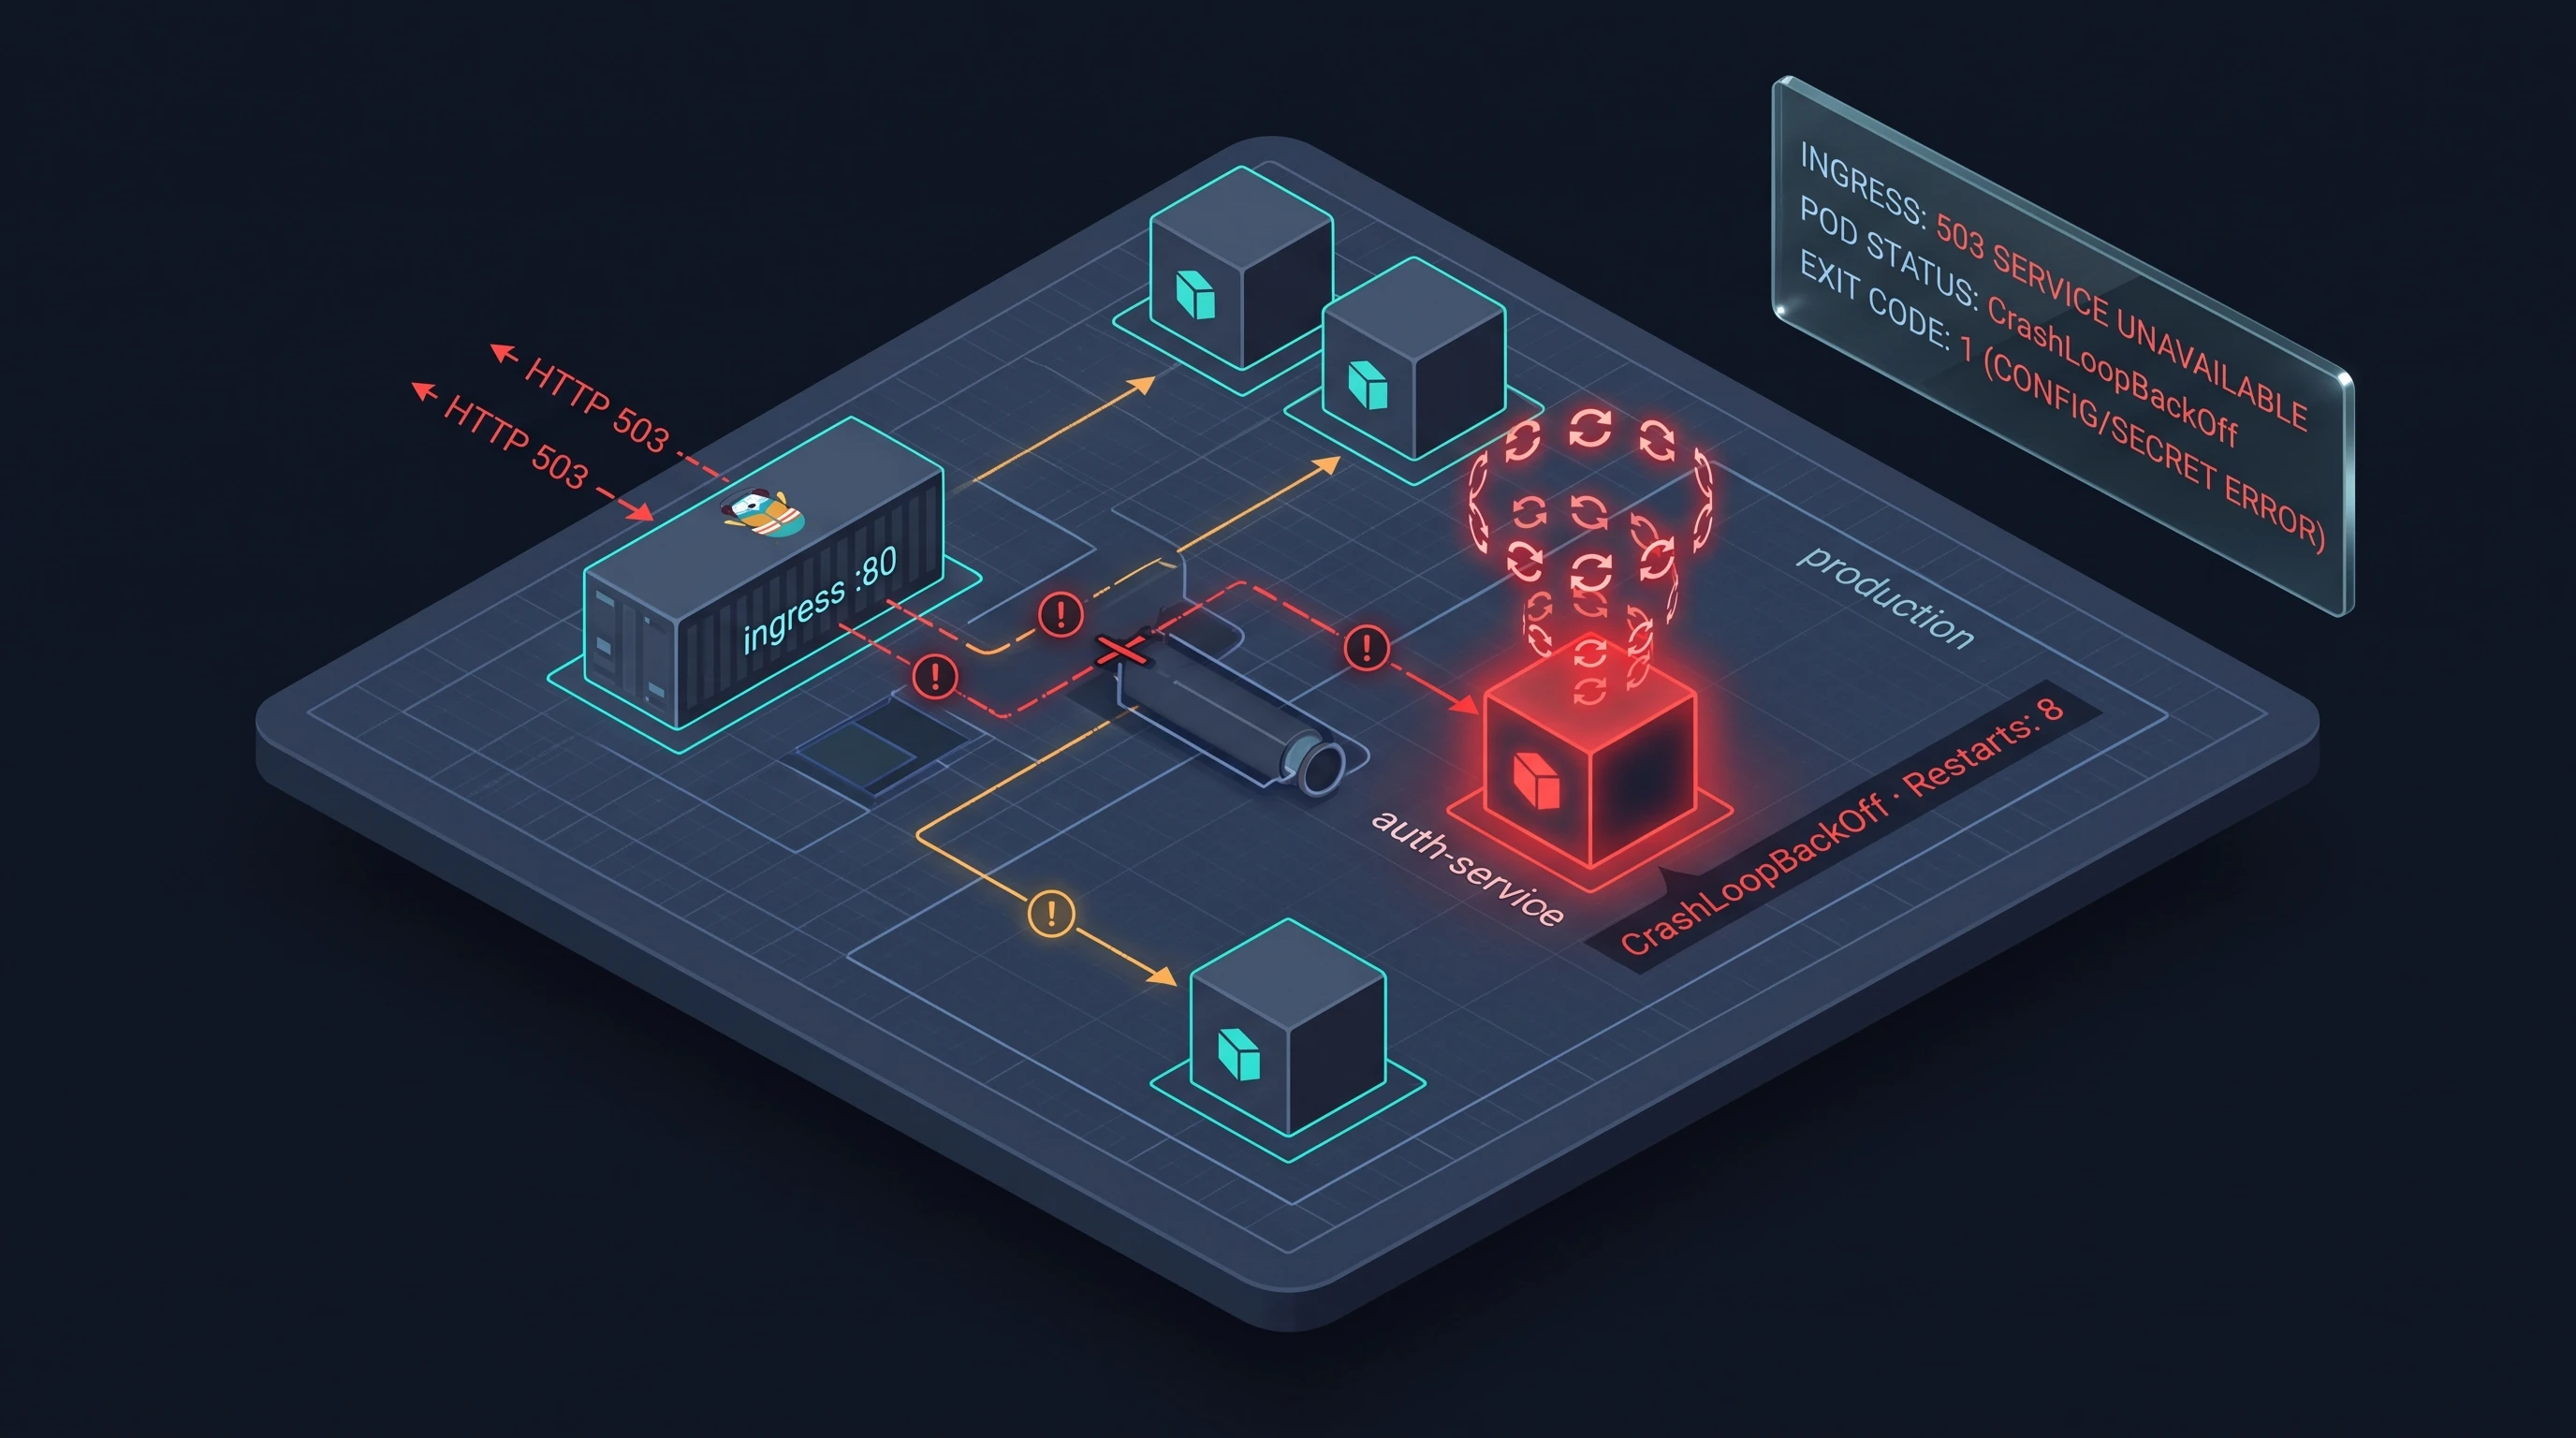
Incident #22 — Kubernetes Microservices CrashLoopBackOff
The production Ingress gateway returns HTTP 503 Service Unavailable. Workloads in the auth namespace are crashing with OOMKill/CrashLoop. Use live kubectl diagnostics to resolve.
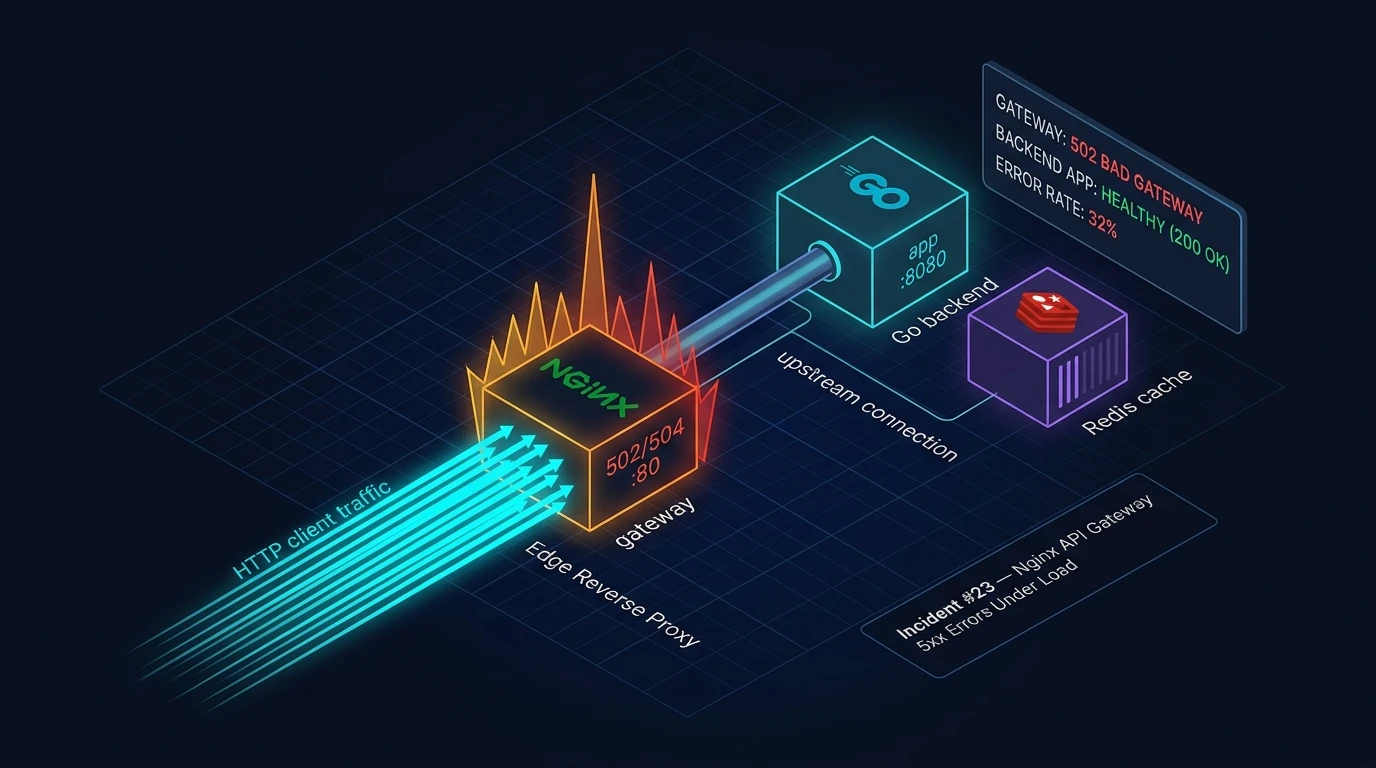
Incident #23 — API Gateway 5xx Errors Under Load
Customers see intermittent 502/503/504 errors from the API under moderate load. The backend reports healthy — the failure is in the upstream connection pool of Nginx.
Kubernetes Firefights
Incident #22 — Kubernetes Microservices CrashLoopBackOff
The production Ingress gateway returns HTTP 503 Service Unavailable. Workloads in the auth namespace are crashing with OOMKill/CrashLoop. Use live kubectl diagnostics to resolve.
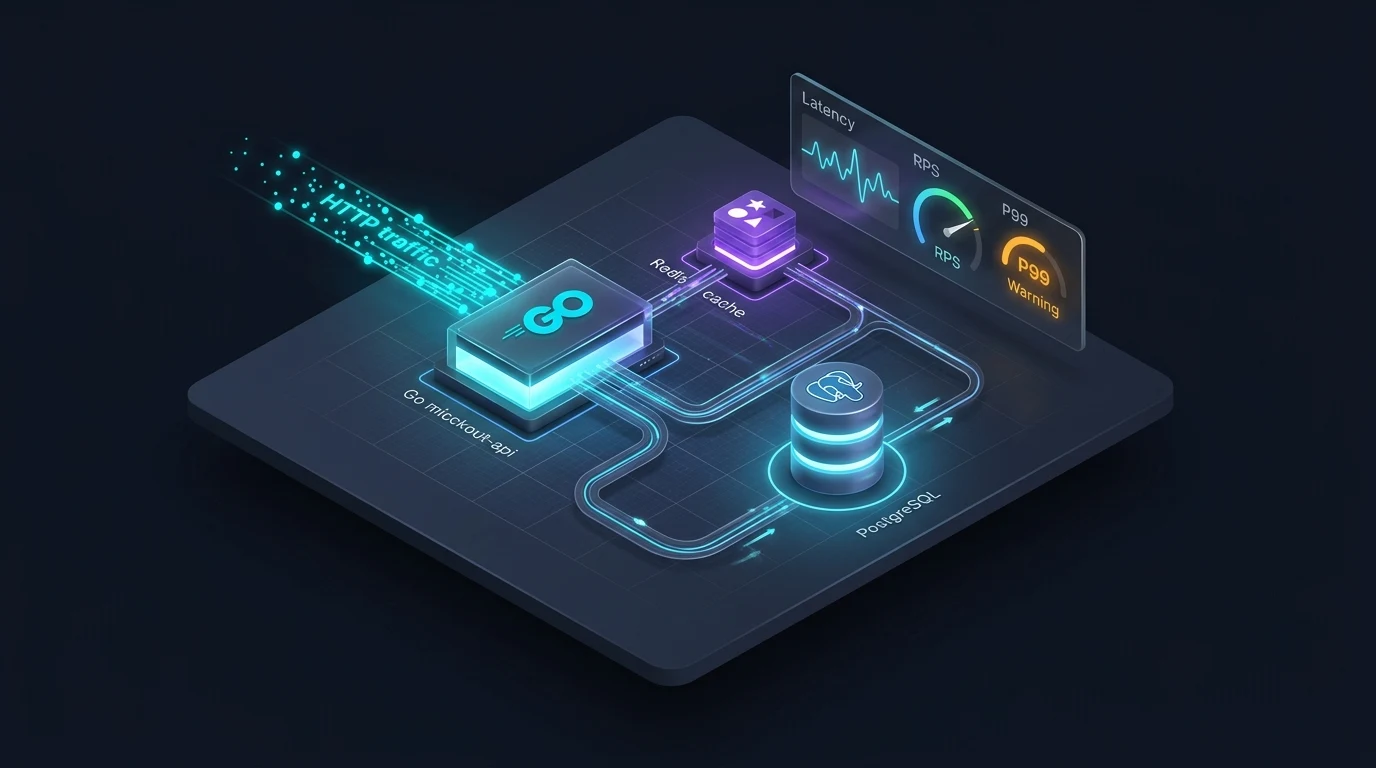
Incident #21 — Payment Gateway Outage Triage
E-commerce checkout transactions are failing with timeout cascades across payment pods. Isolate faulty sidecars, clear socket leaks, and restore payment processing.
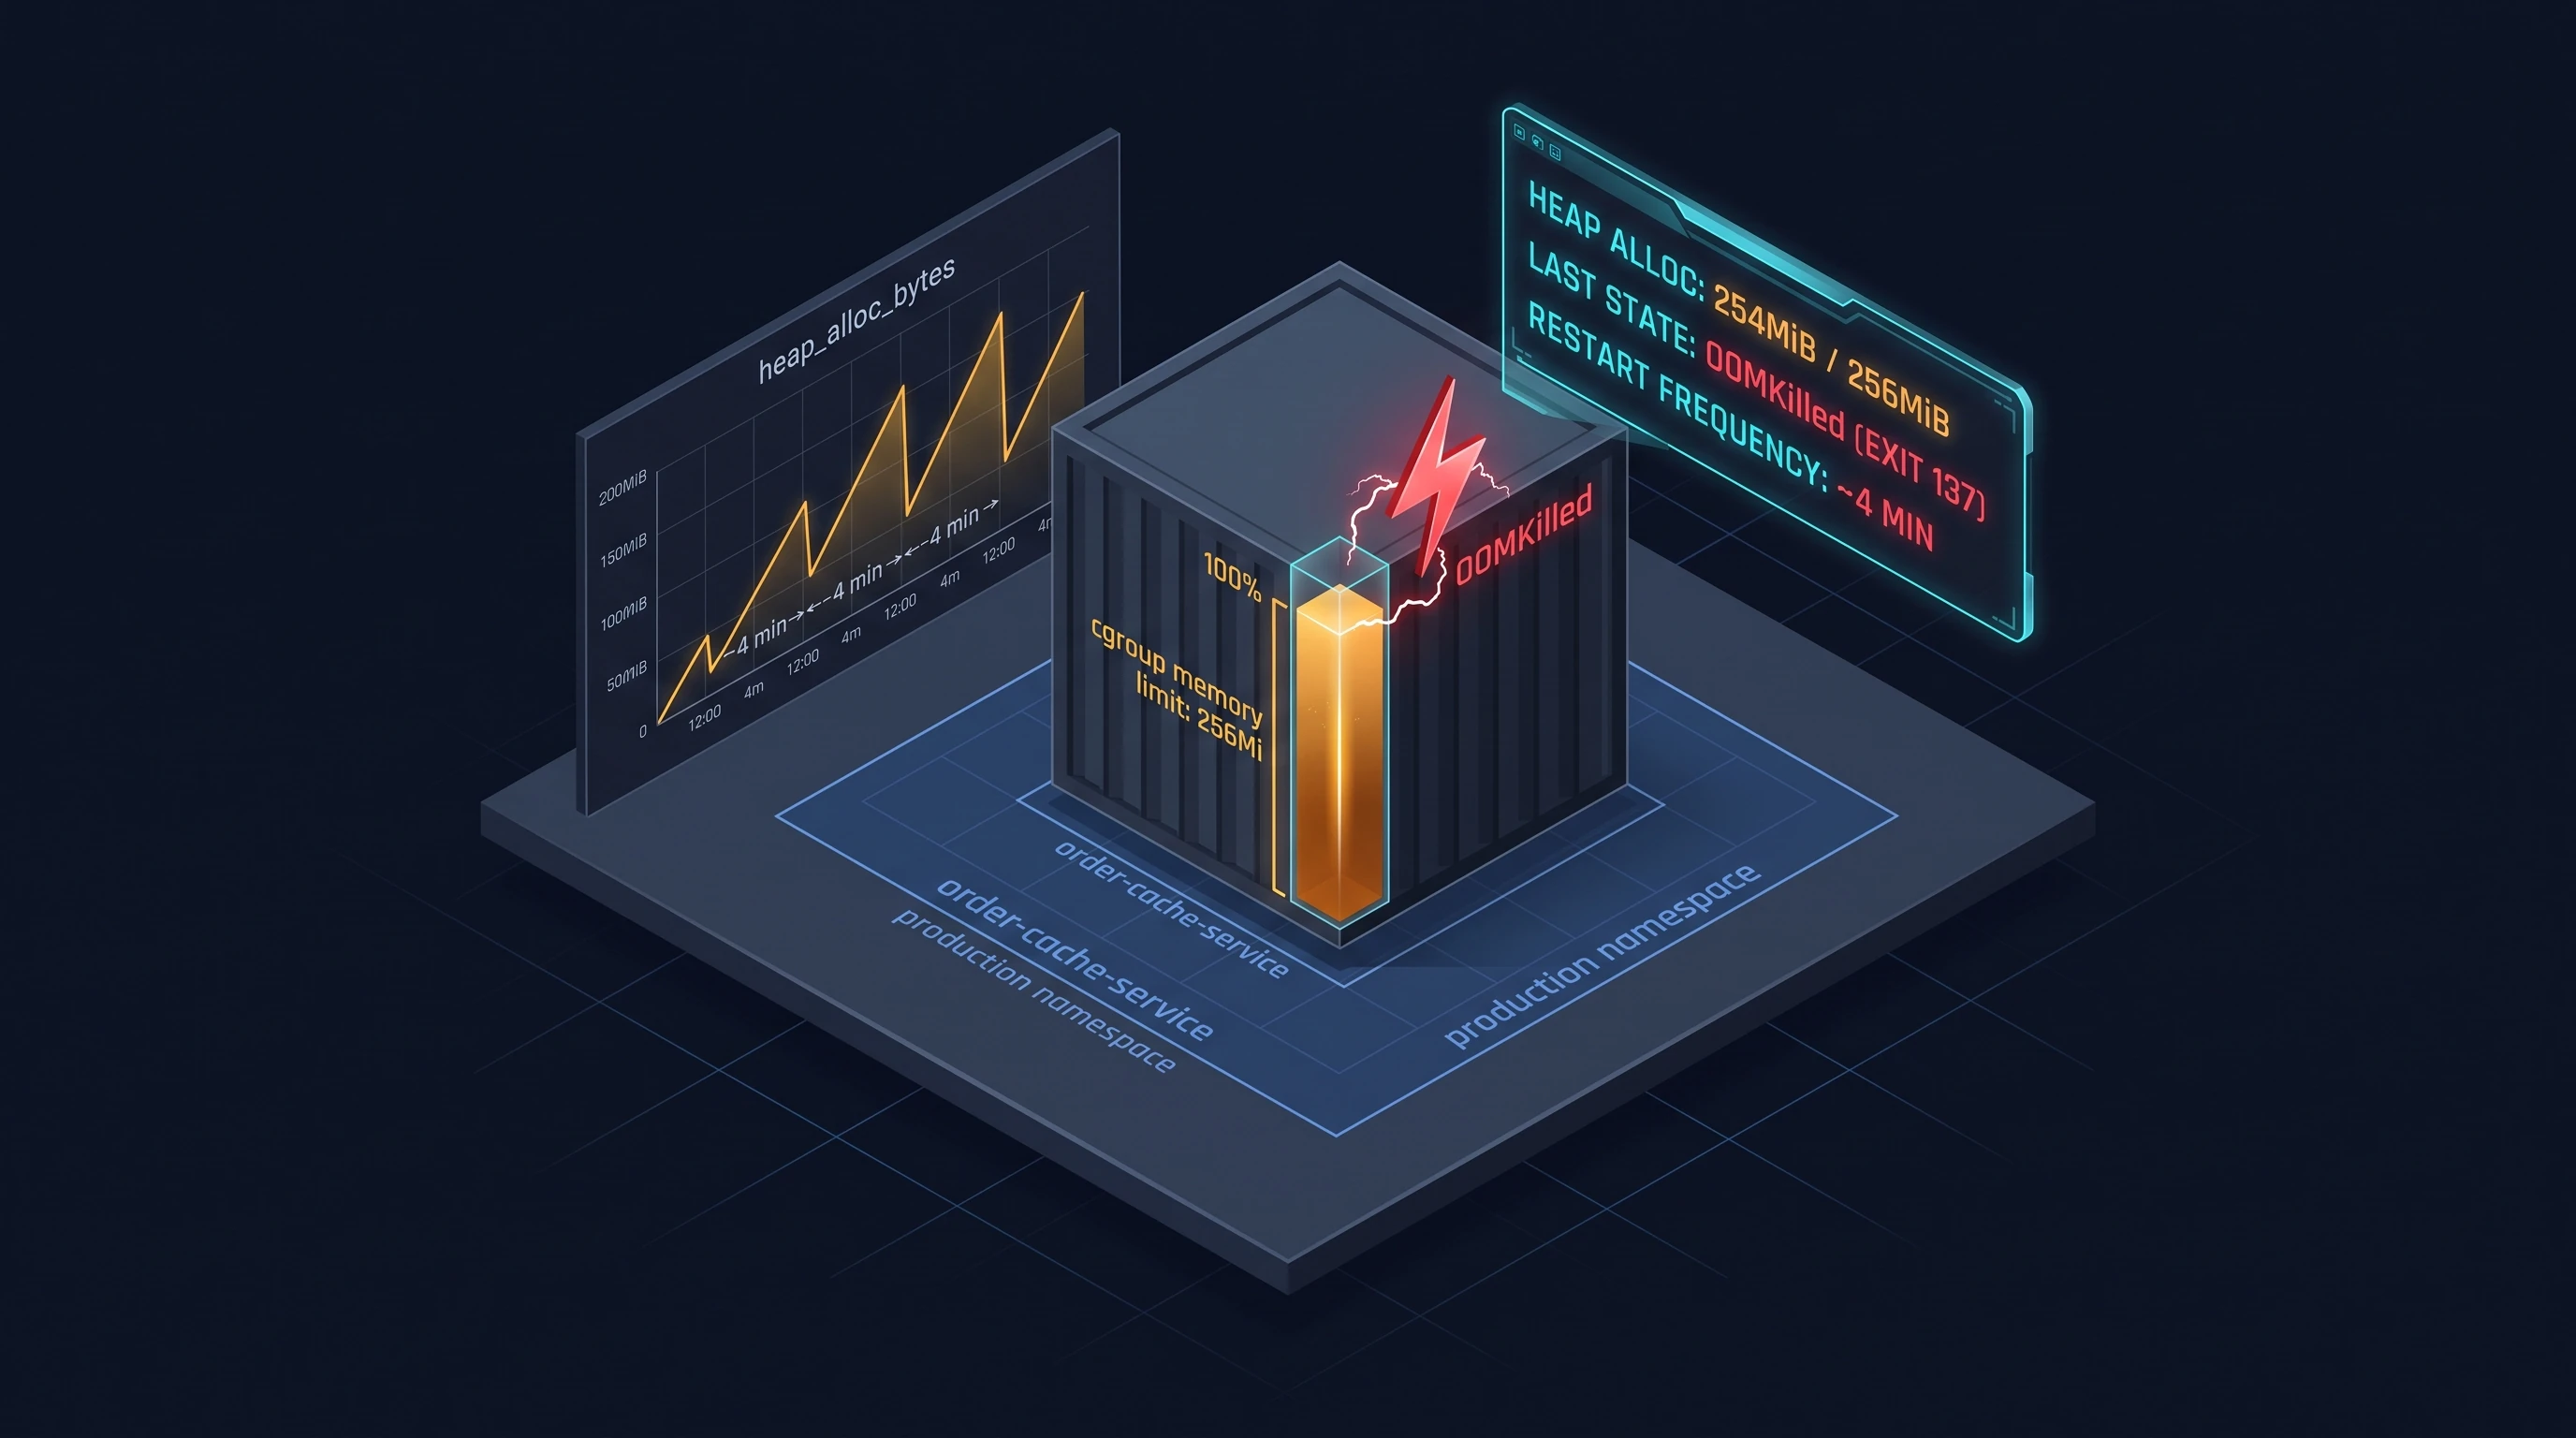
Incident #32 — Go Memory Leak & OOMKill Rolling Restarts
Pod replicas are sequentially killed every 12 minutes by the Linux cgroup OOM killer during peak load. Analyze pprof heap profiles and tune memory limits.
Linux & Kernel
Incident #56 — Report Exports Fail After a Deployment
Report exports fail after a worker deployment while the HTTP health check stays green. Trace real gzip child processes, identify PID exhaustion, and safely roll back the release.
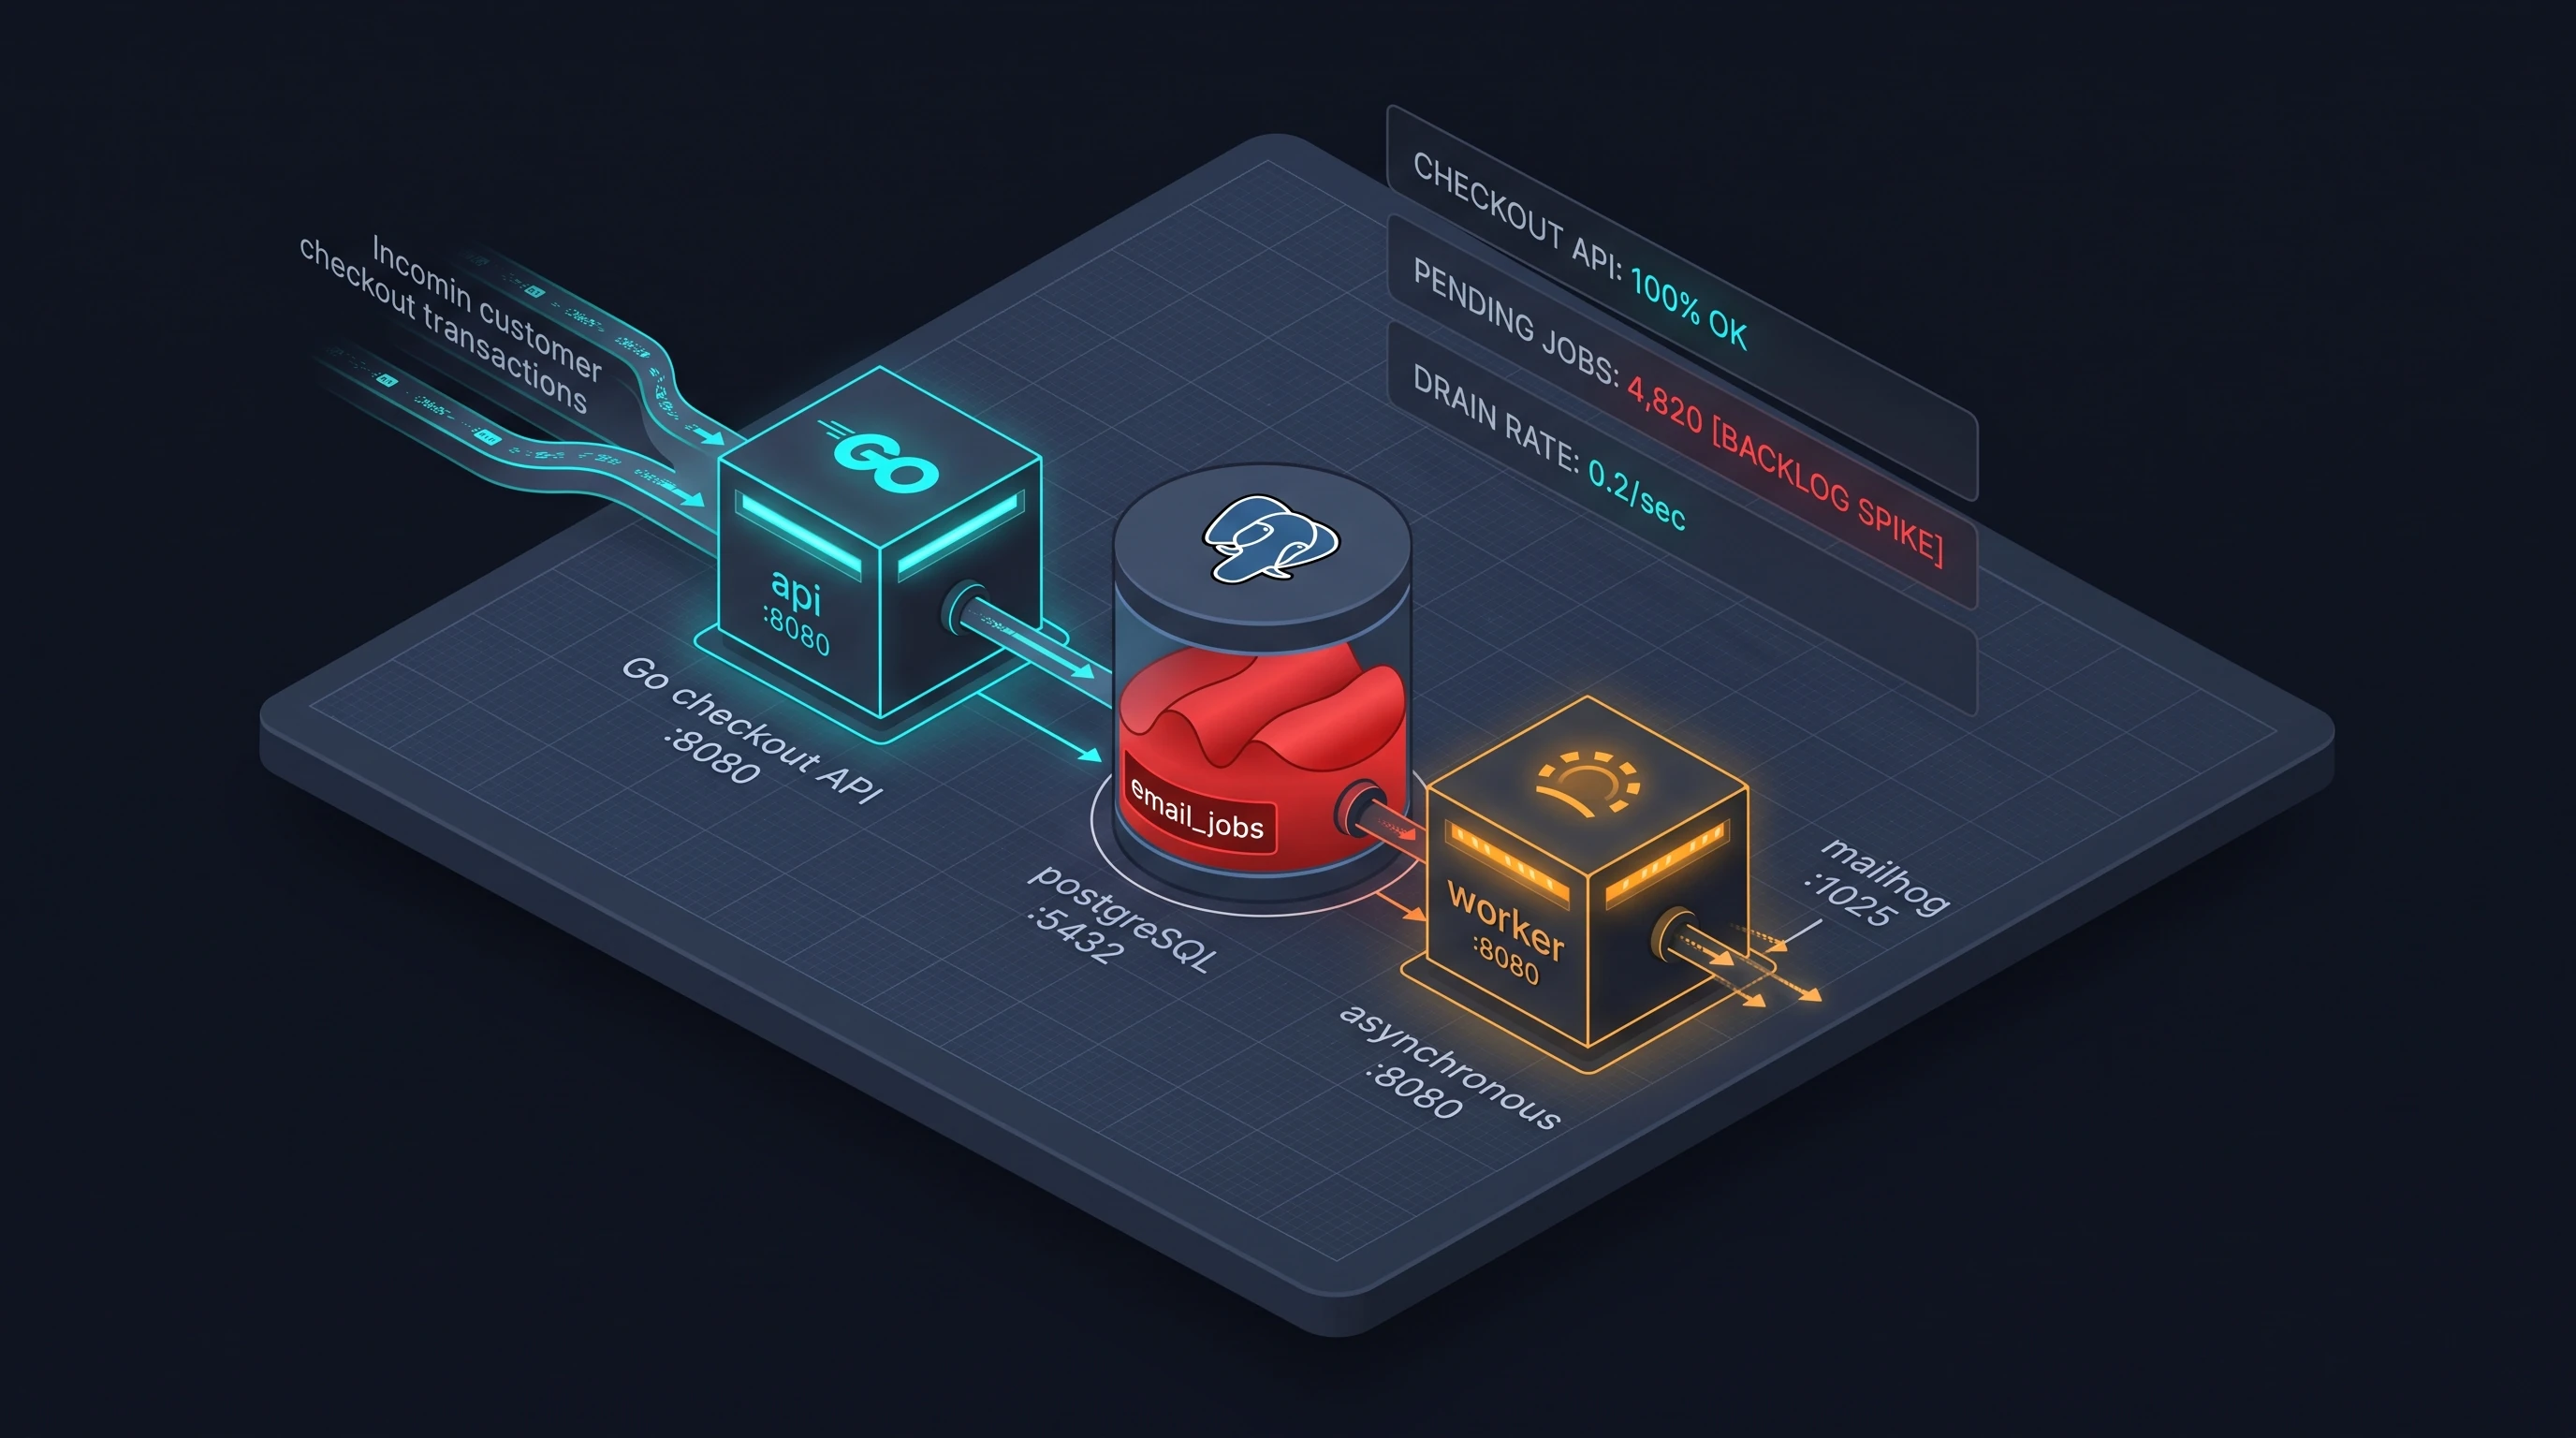
Incident #24 — Background Worker Queue Meltdown
Checkouts succeed and payments are captured, but confirmation emails and order pipelines aren't processing. Investigate asynchronous queue backpressure and lock contention.
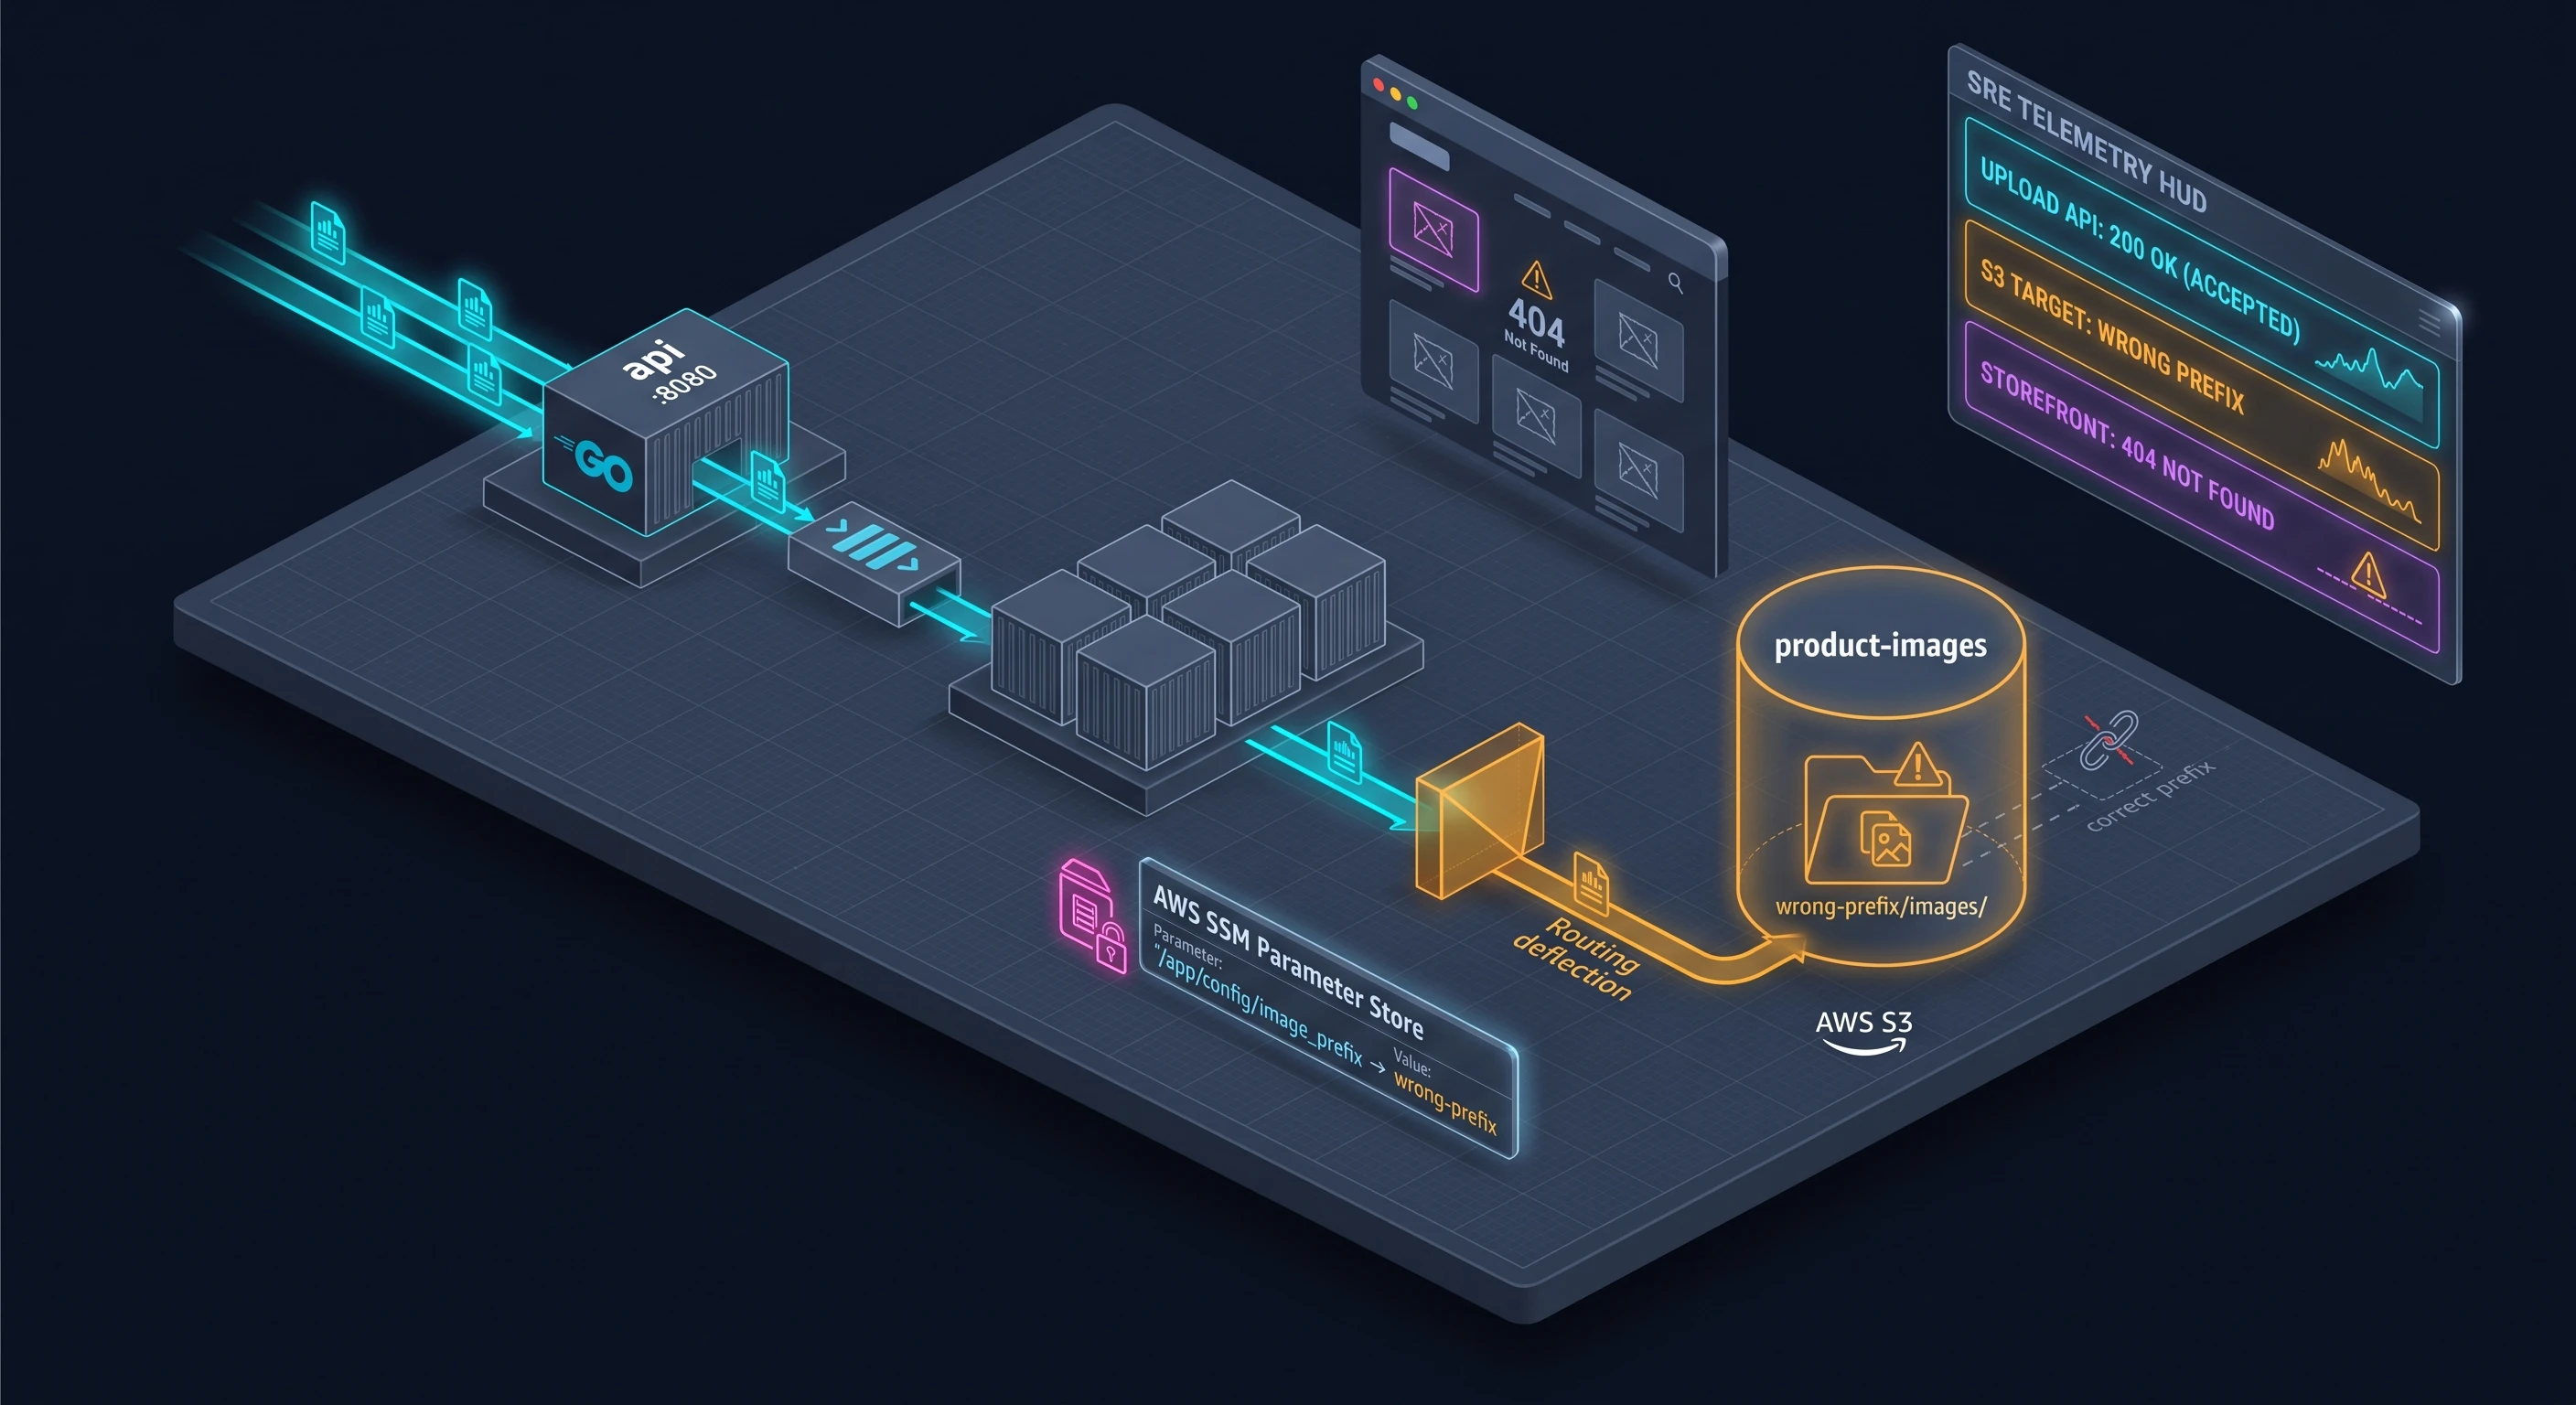
Incident #25 — Product Image Uploads Failing (S3)
The upload API returns 200 OK to every request, but photos never appear on the storefront. Investigate AWS-shaped S3 bucket policies and SSM key path mismatches.
Docker Incidents
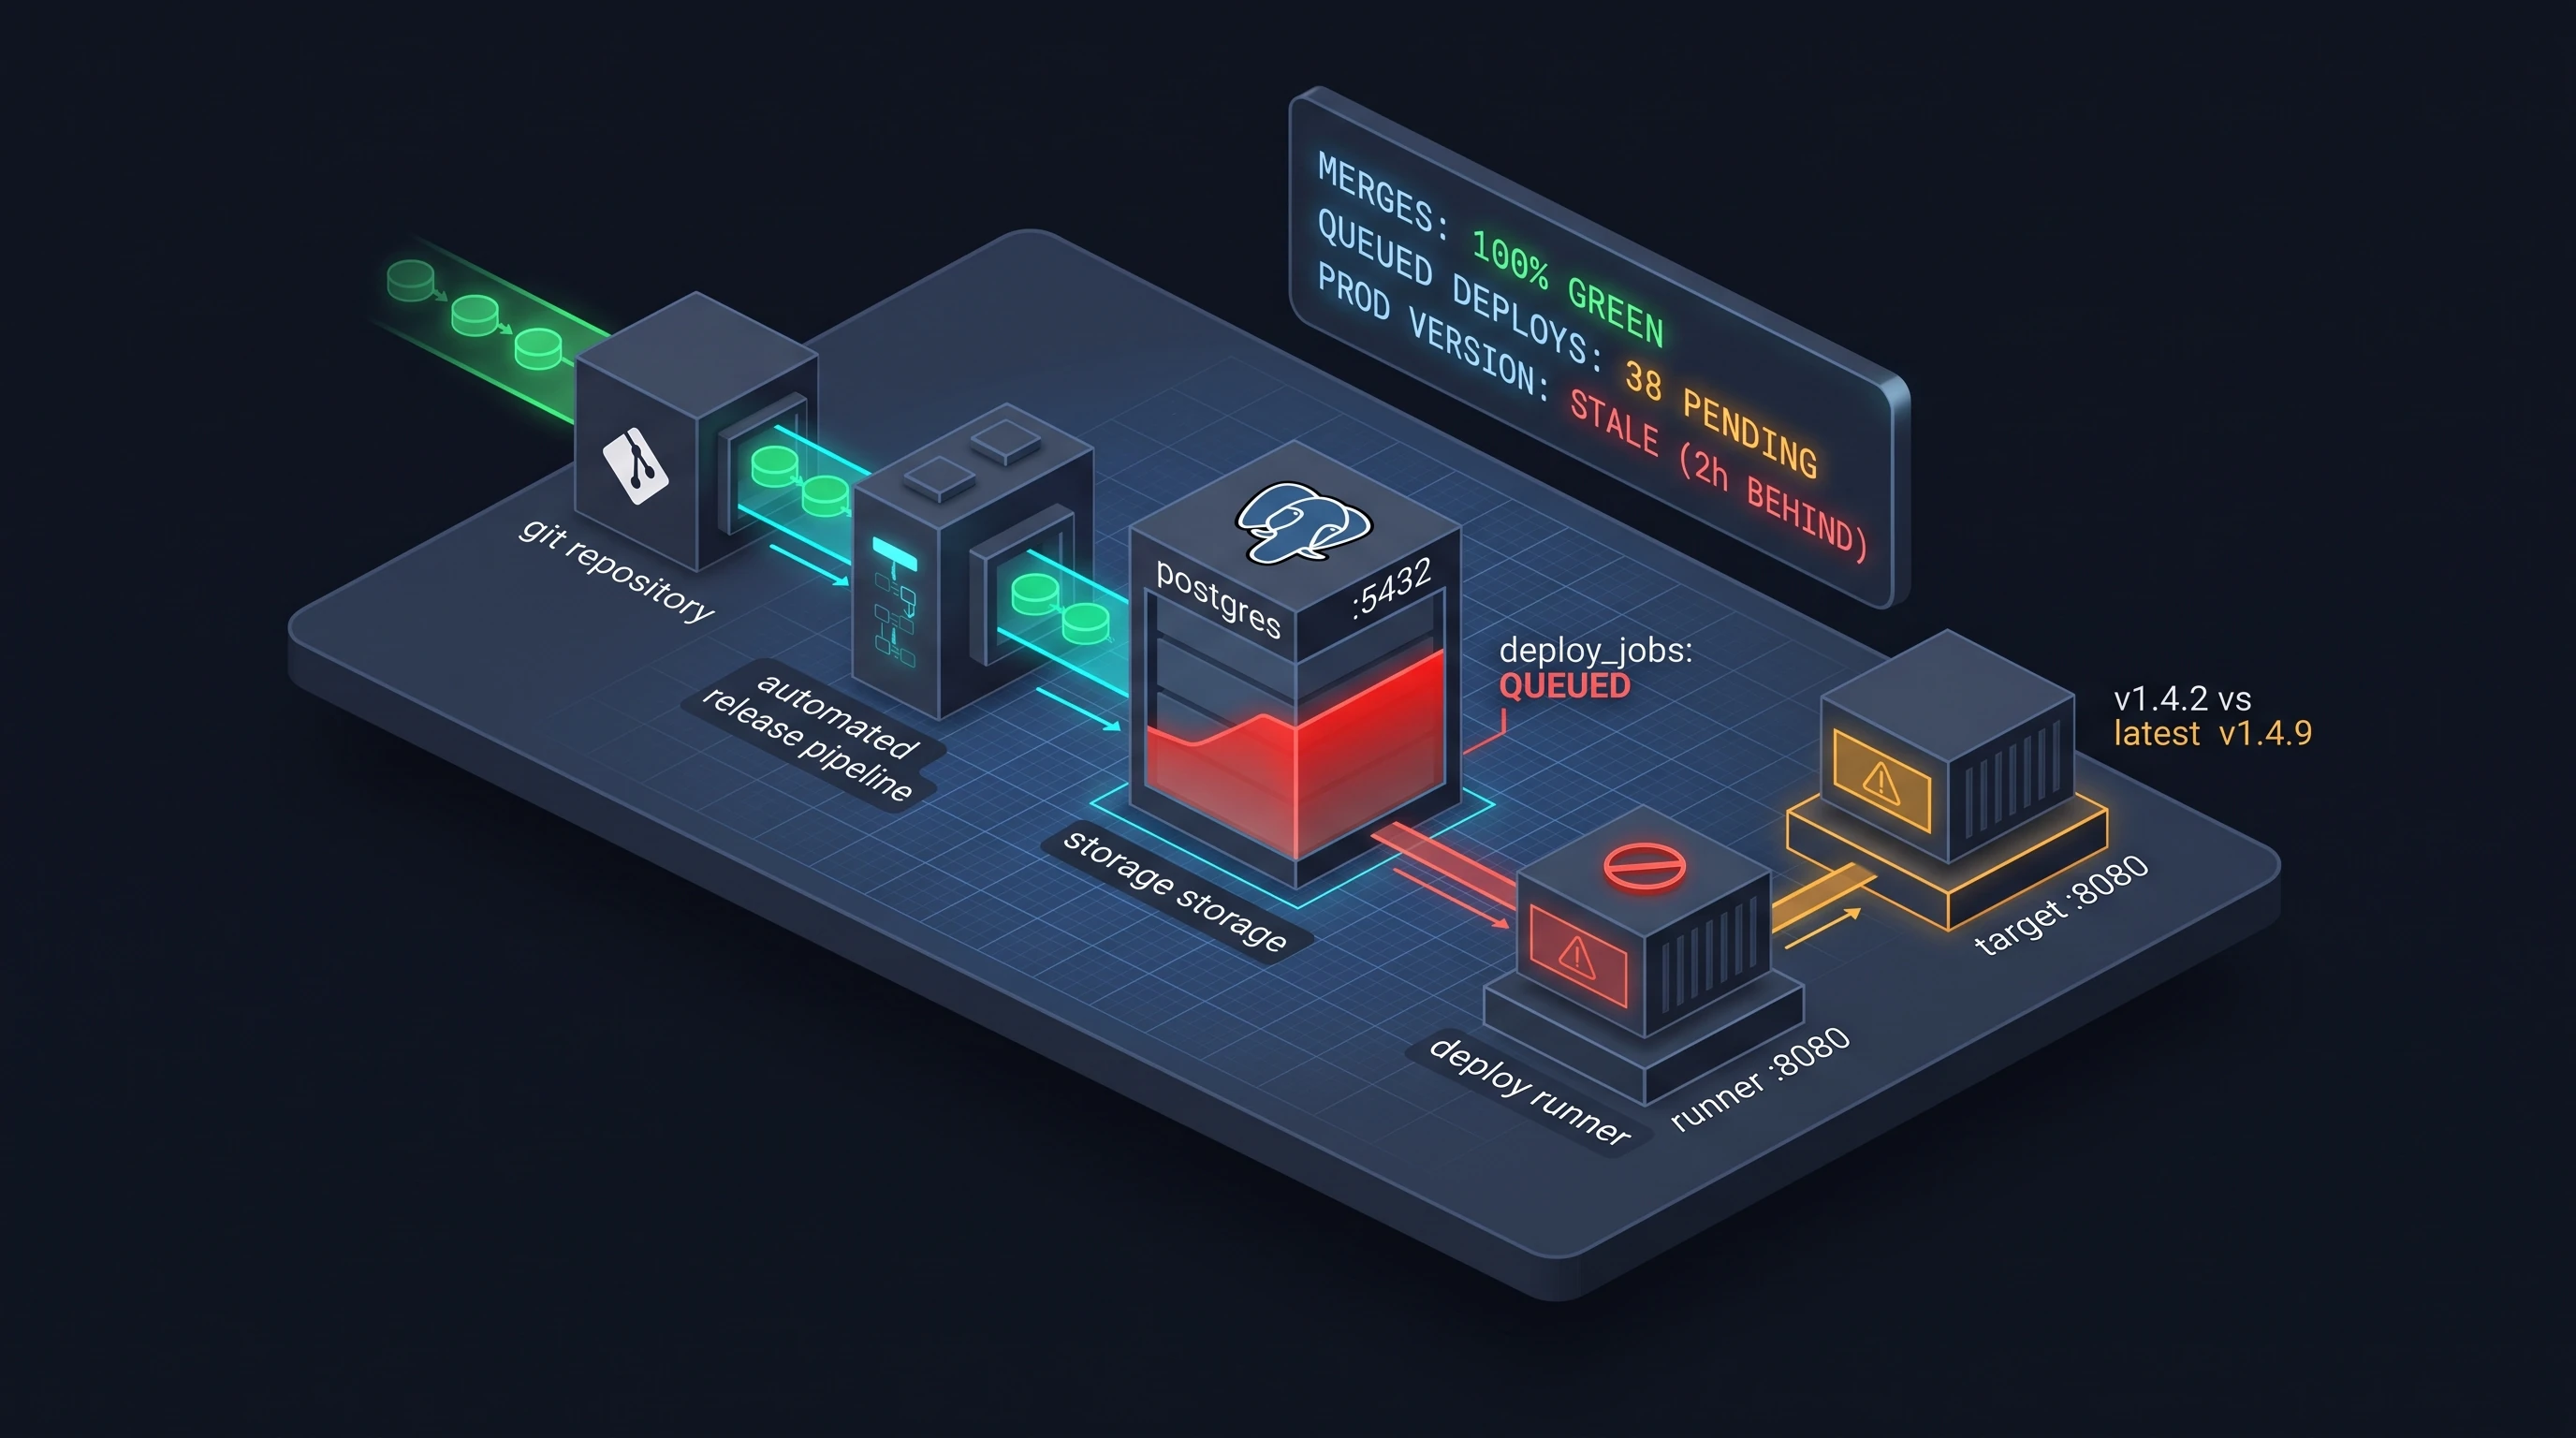
Incident #26 — Deploy Pipeline Backlog & Runner Starvation
PRs merge to main and CI reports green, but production containers never update. Investigate asynchronous deploy queue locks and runner resource exhaustion.
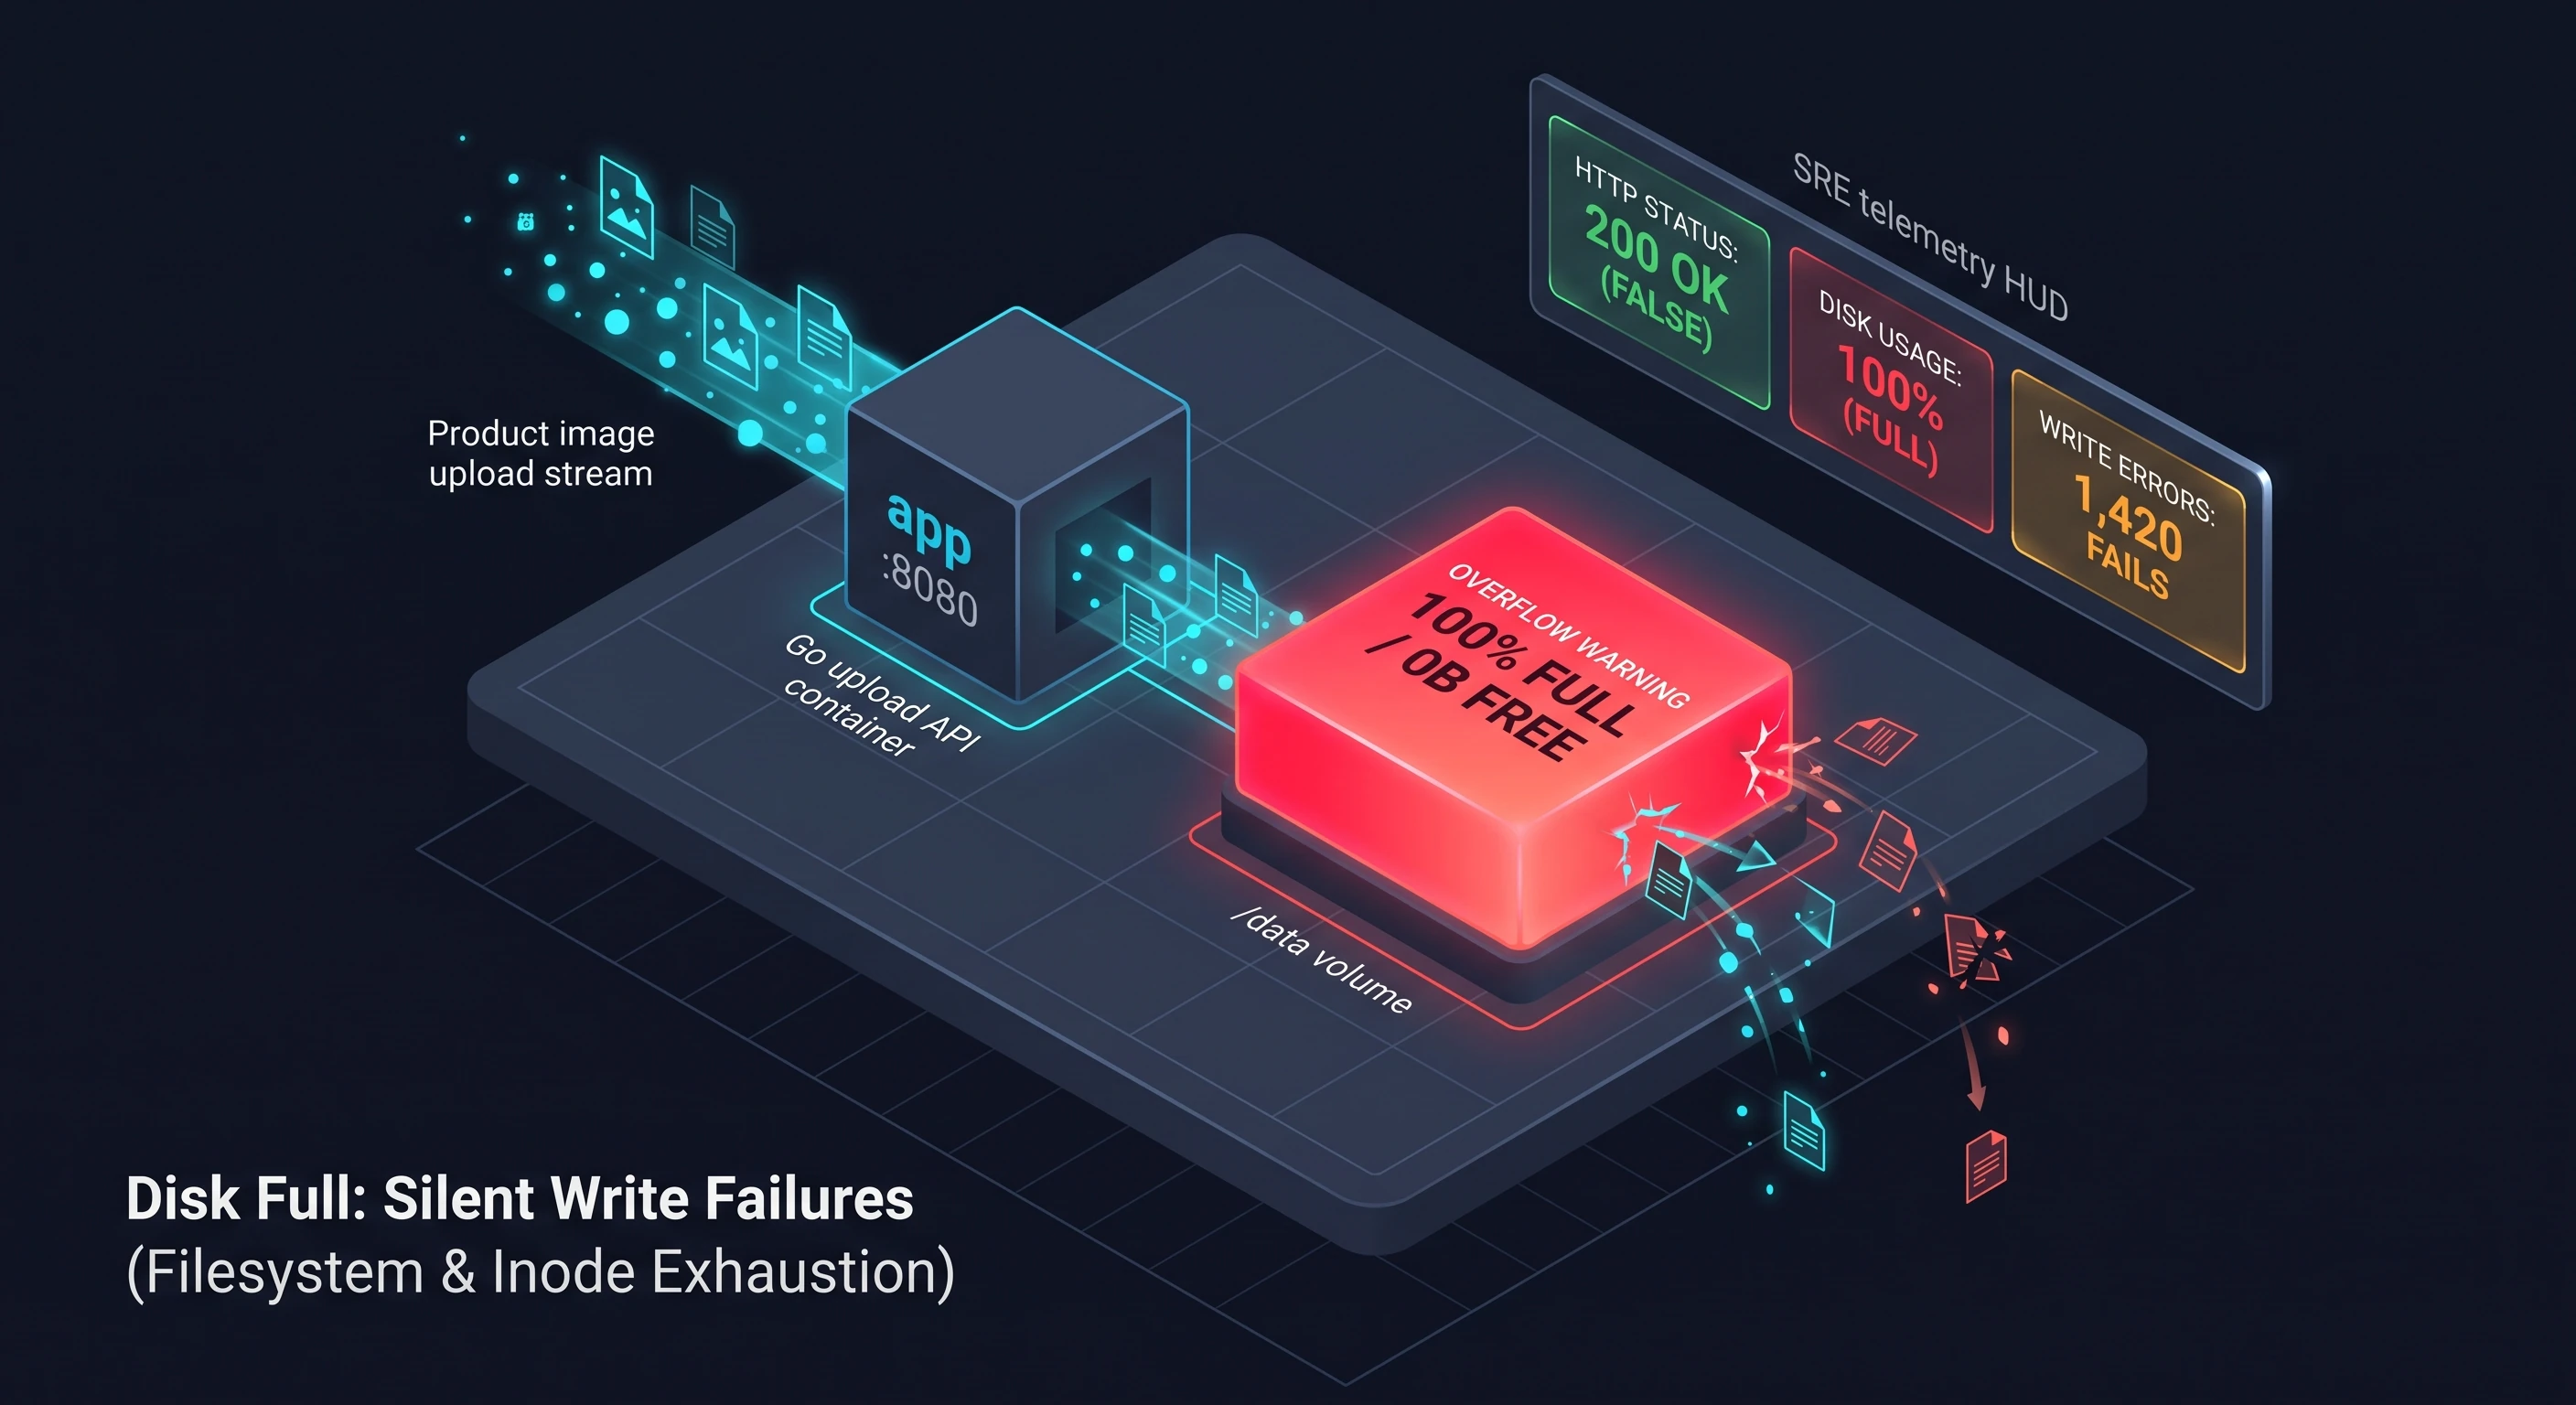
Incident #31 — Docker /var/lib/docker Inode & Disk Saturation
Containers fail to spawn with 'no space left on device', even though df -h shows 40% disk space free. Uncover inode exhaustion from abandoned build caches.
Incident #63 — The Page That Landed Mid-Deploy
A routine release is queued — ship it. While you're heads-down on your ticket, a real Postgres connection-pool leak on an unrelated service self-triggers, unannounced, and every second it goes unnoticed is real, permanent damage.
Networking Incidents
Incident #23 — API Gateway 5xx Errors Under Load
Customers see intermittent 502/503/504 errors from the API under moderate load. The backend reports healthy — the failure is in the upstream connection pool of Nginx.
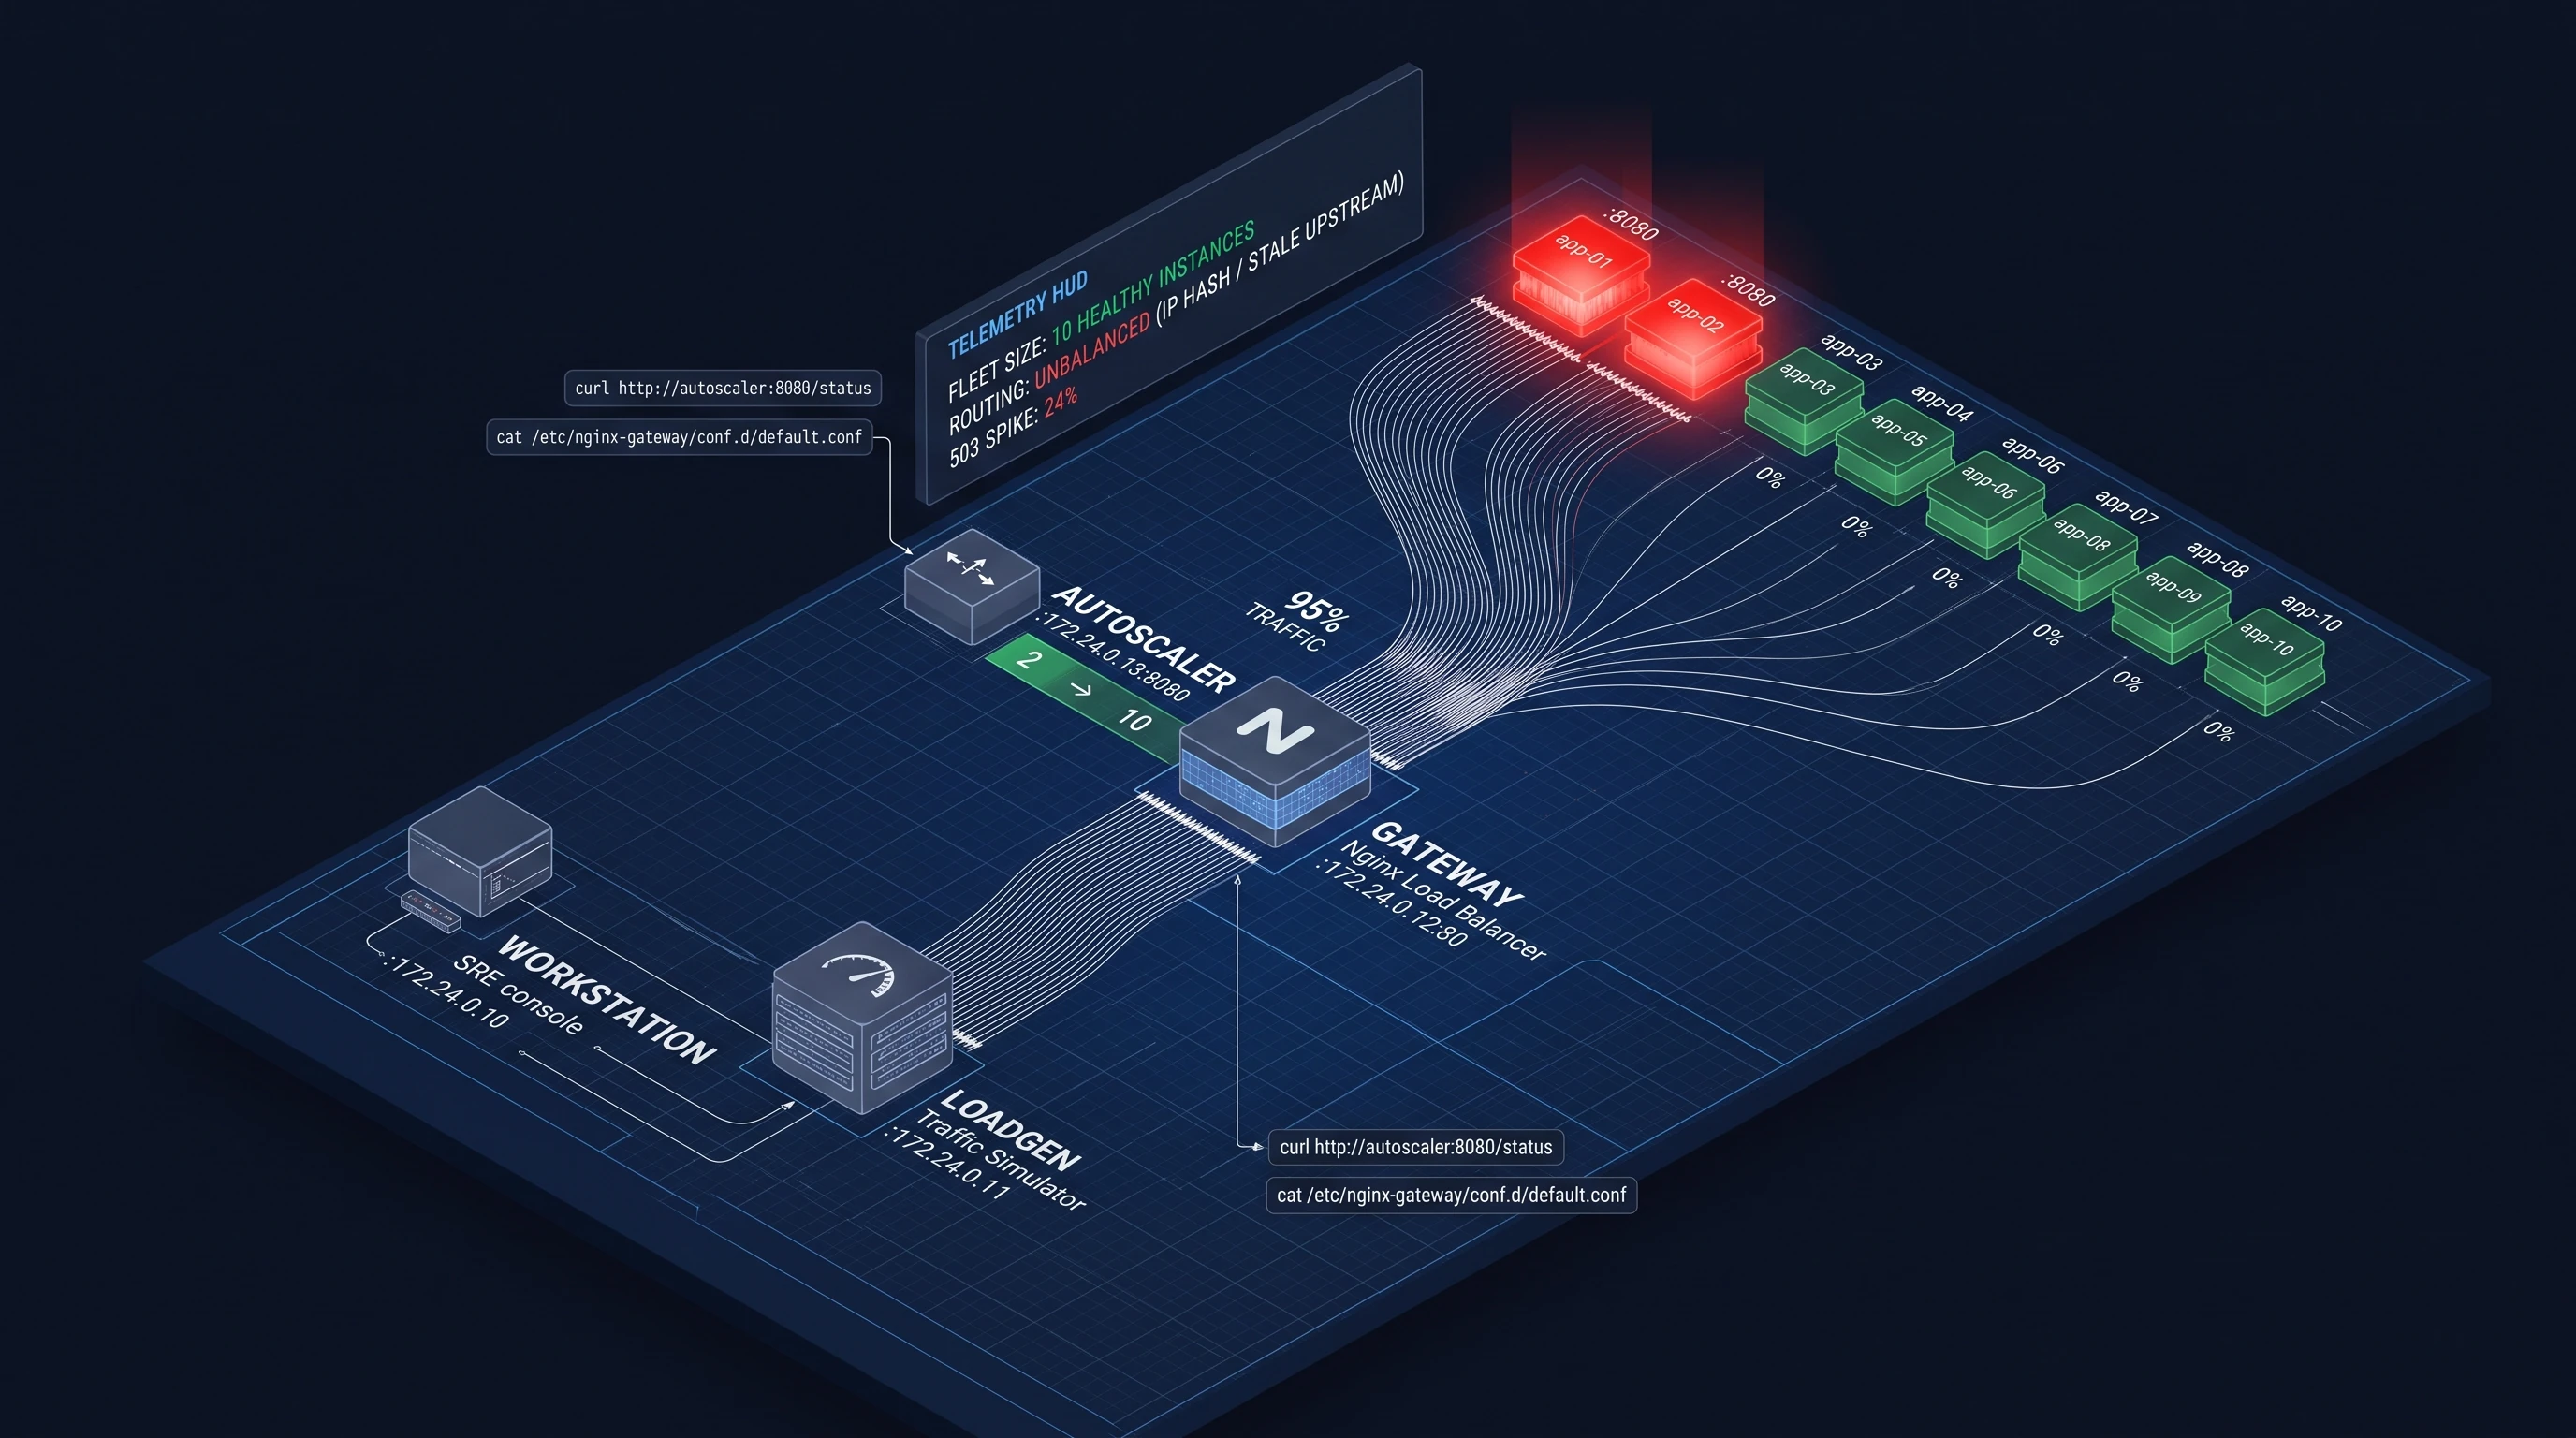
Incident #27 — Flash Sale Traffic Surge: Load Balancer Partition
Traffic surges to 2,000+ RPS. The autoscaler scales backend instances from 2 to 10, but 90% of traffic still lands on one overloaded instance. Fix hash ring imbalance.
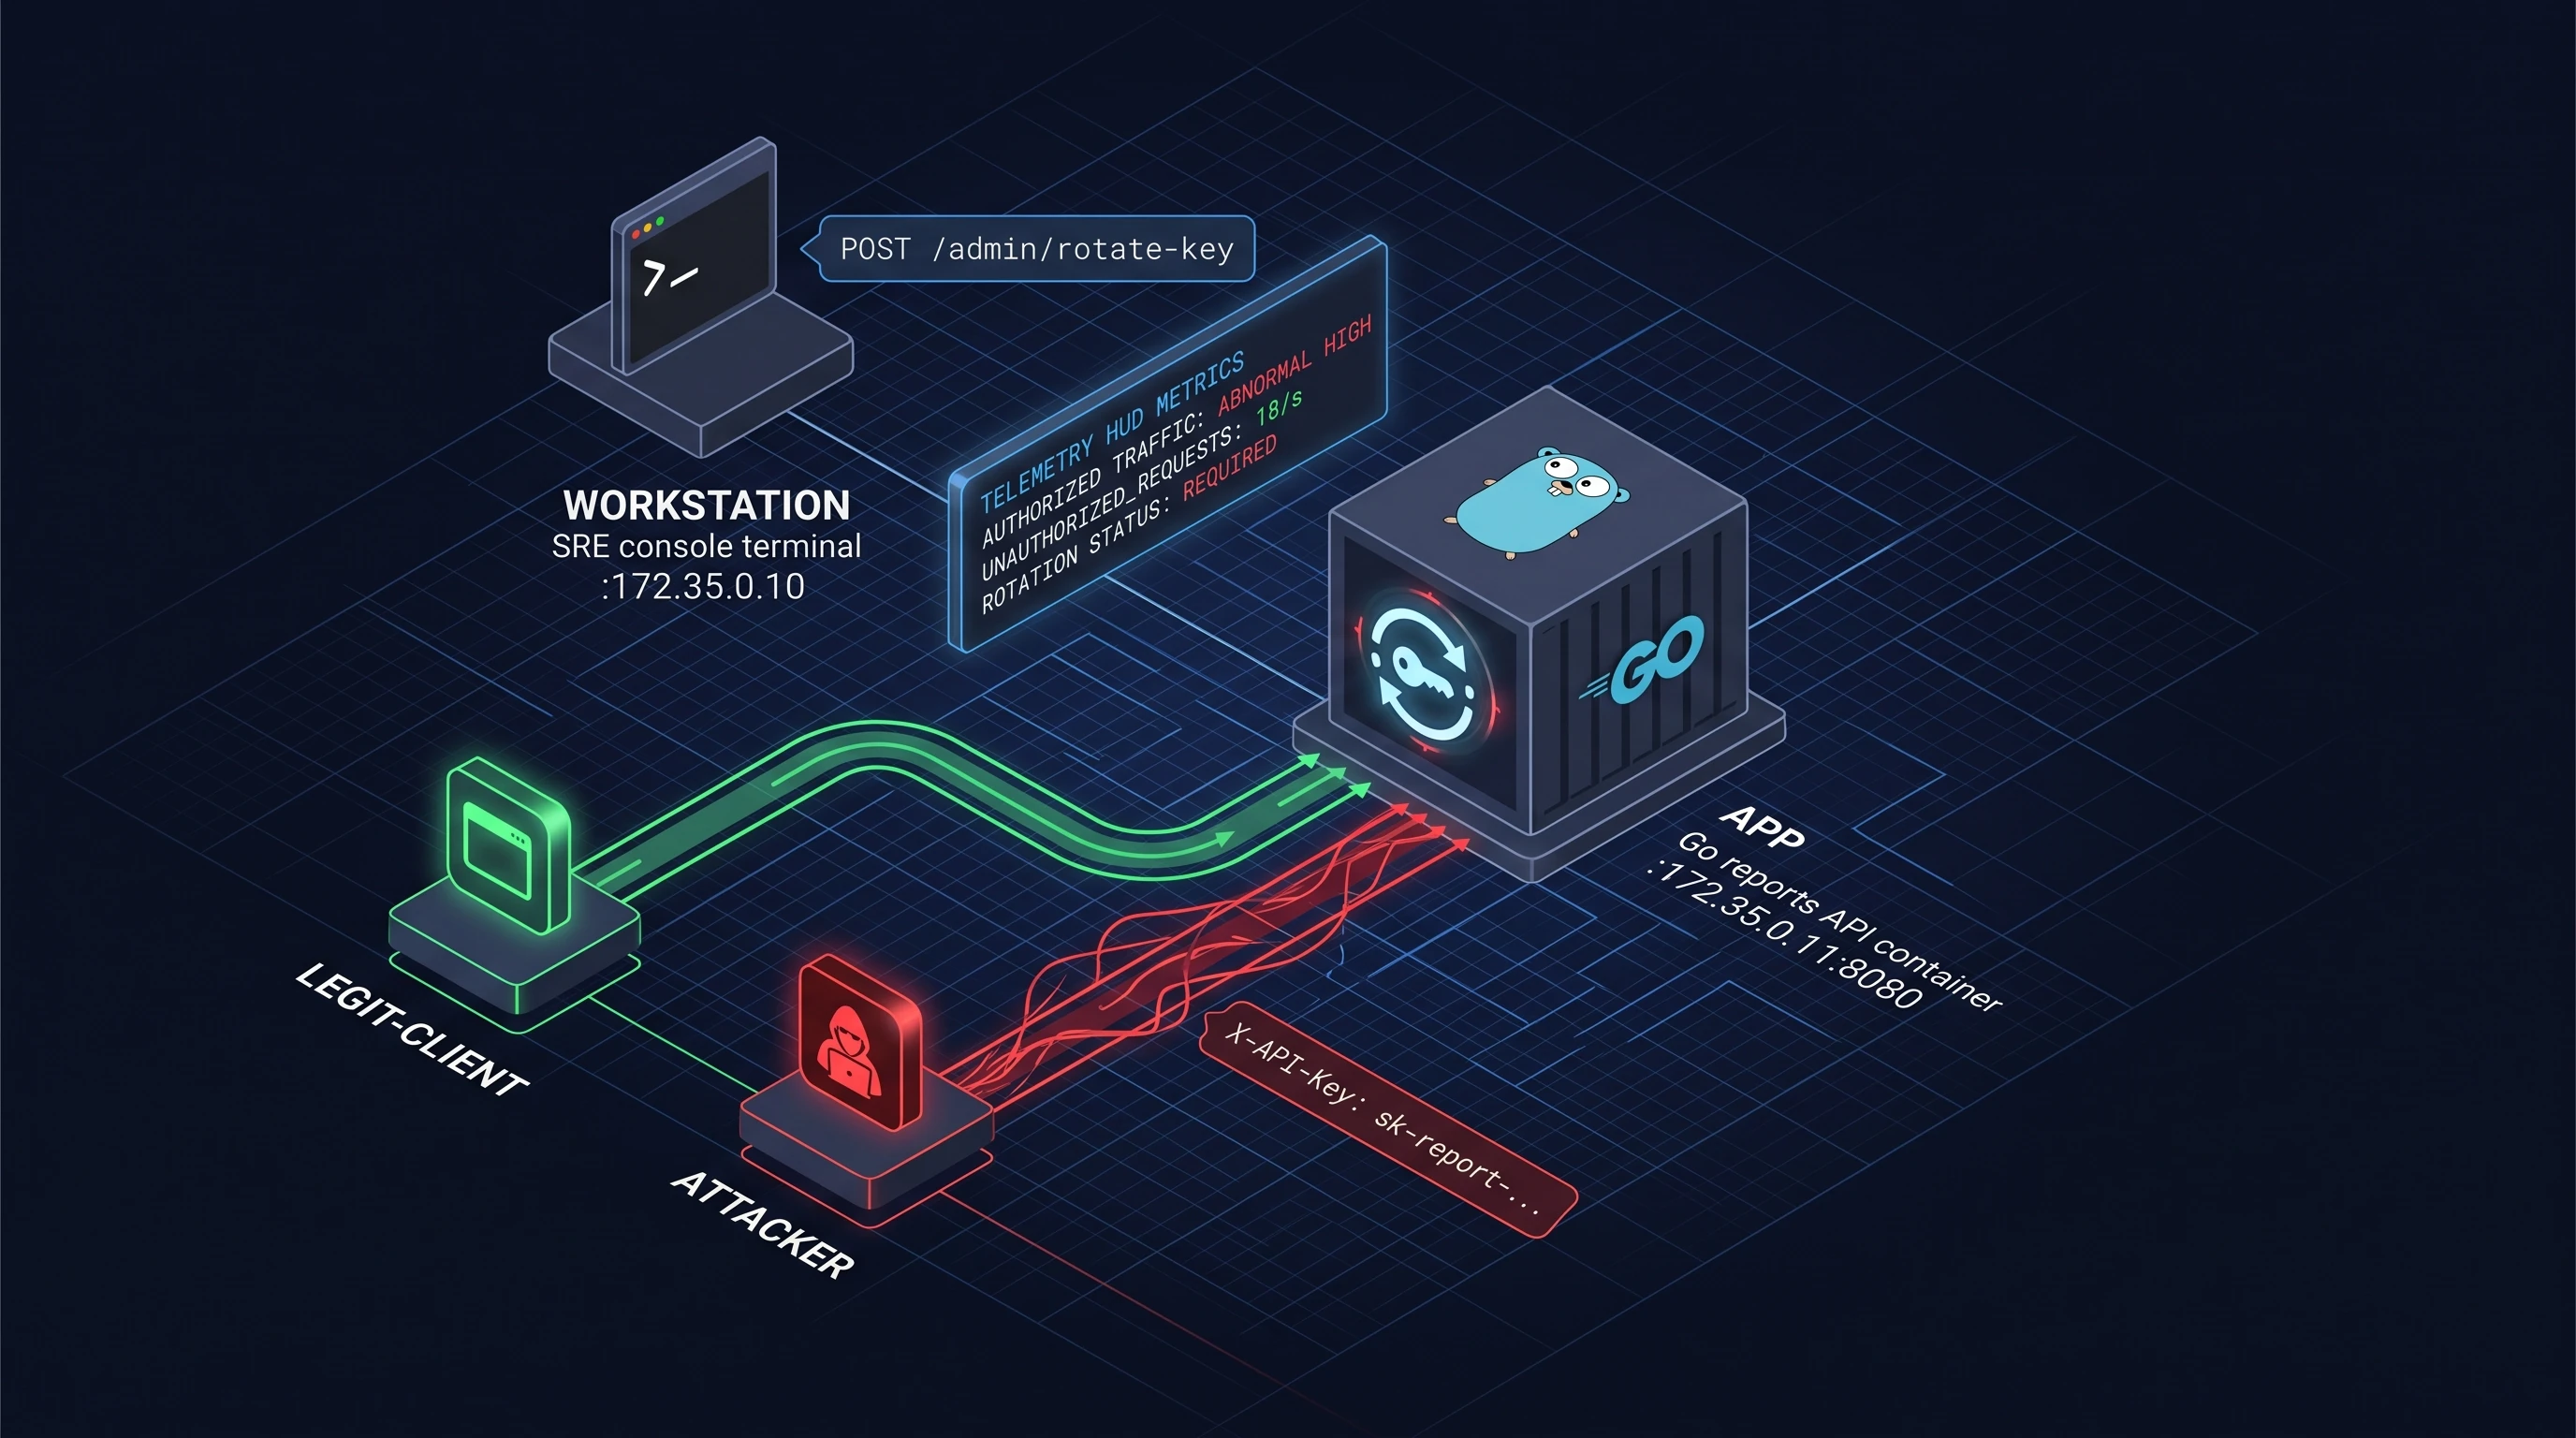
Incident #30 — Ingress TLS Certificate Expiration Outage
Browser TLS warnings halt 100% of consumer traffic. The cert-manager webhook failed silently during secret renewal. Re-issue and hot-reload TLS certs without gateway downtime.
Observability & Data Incidents
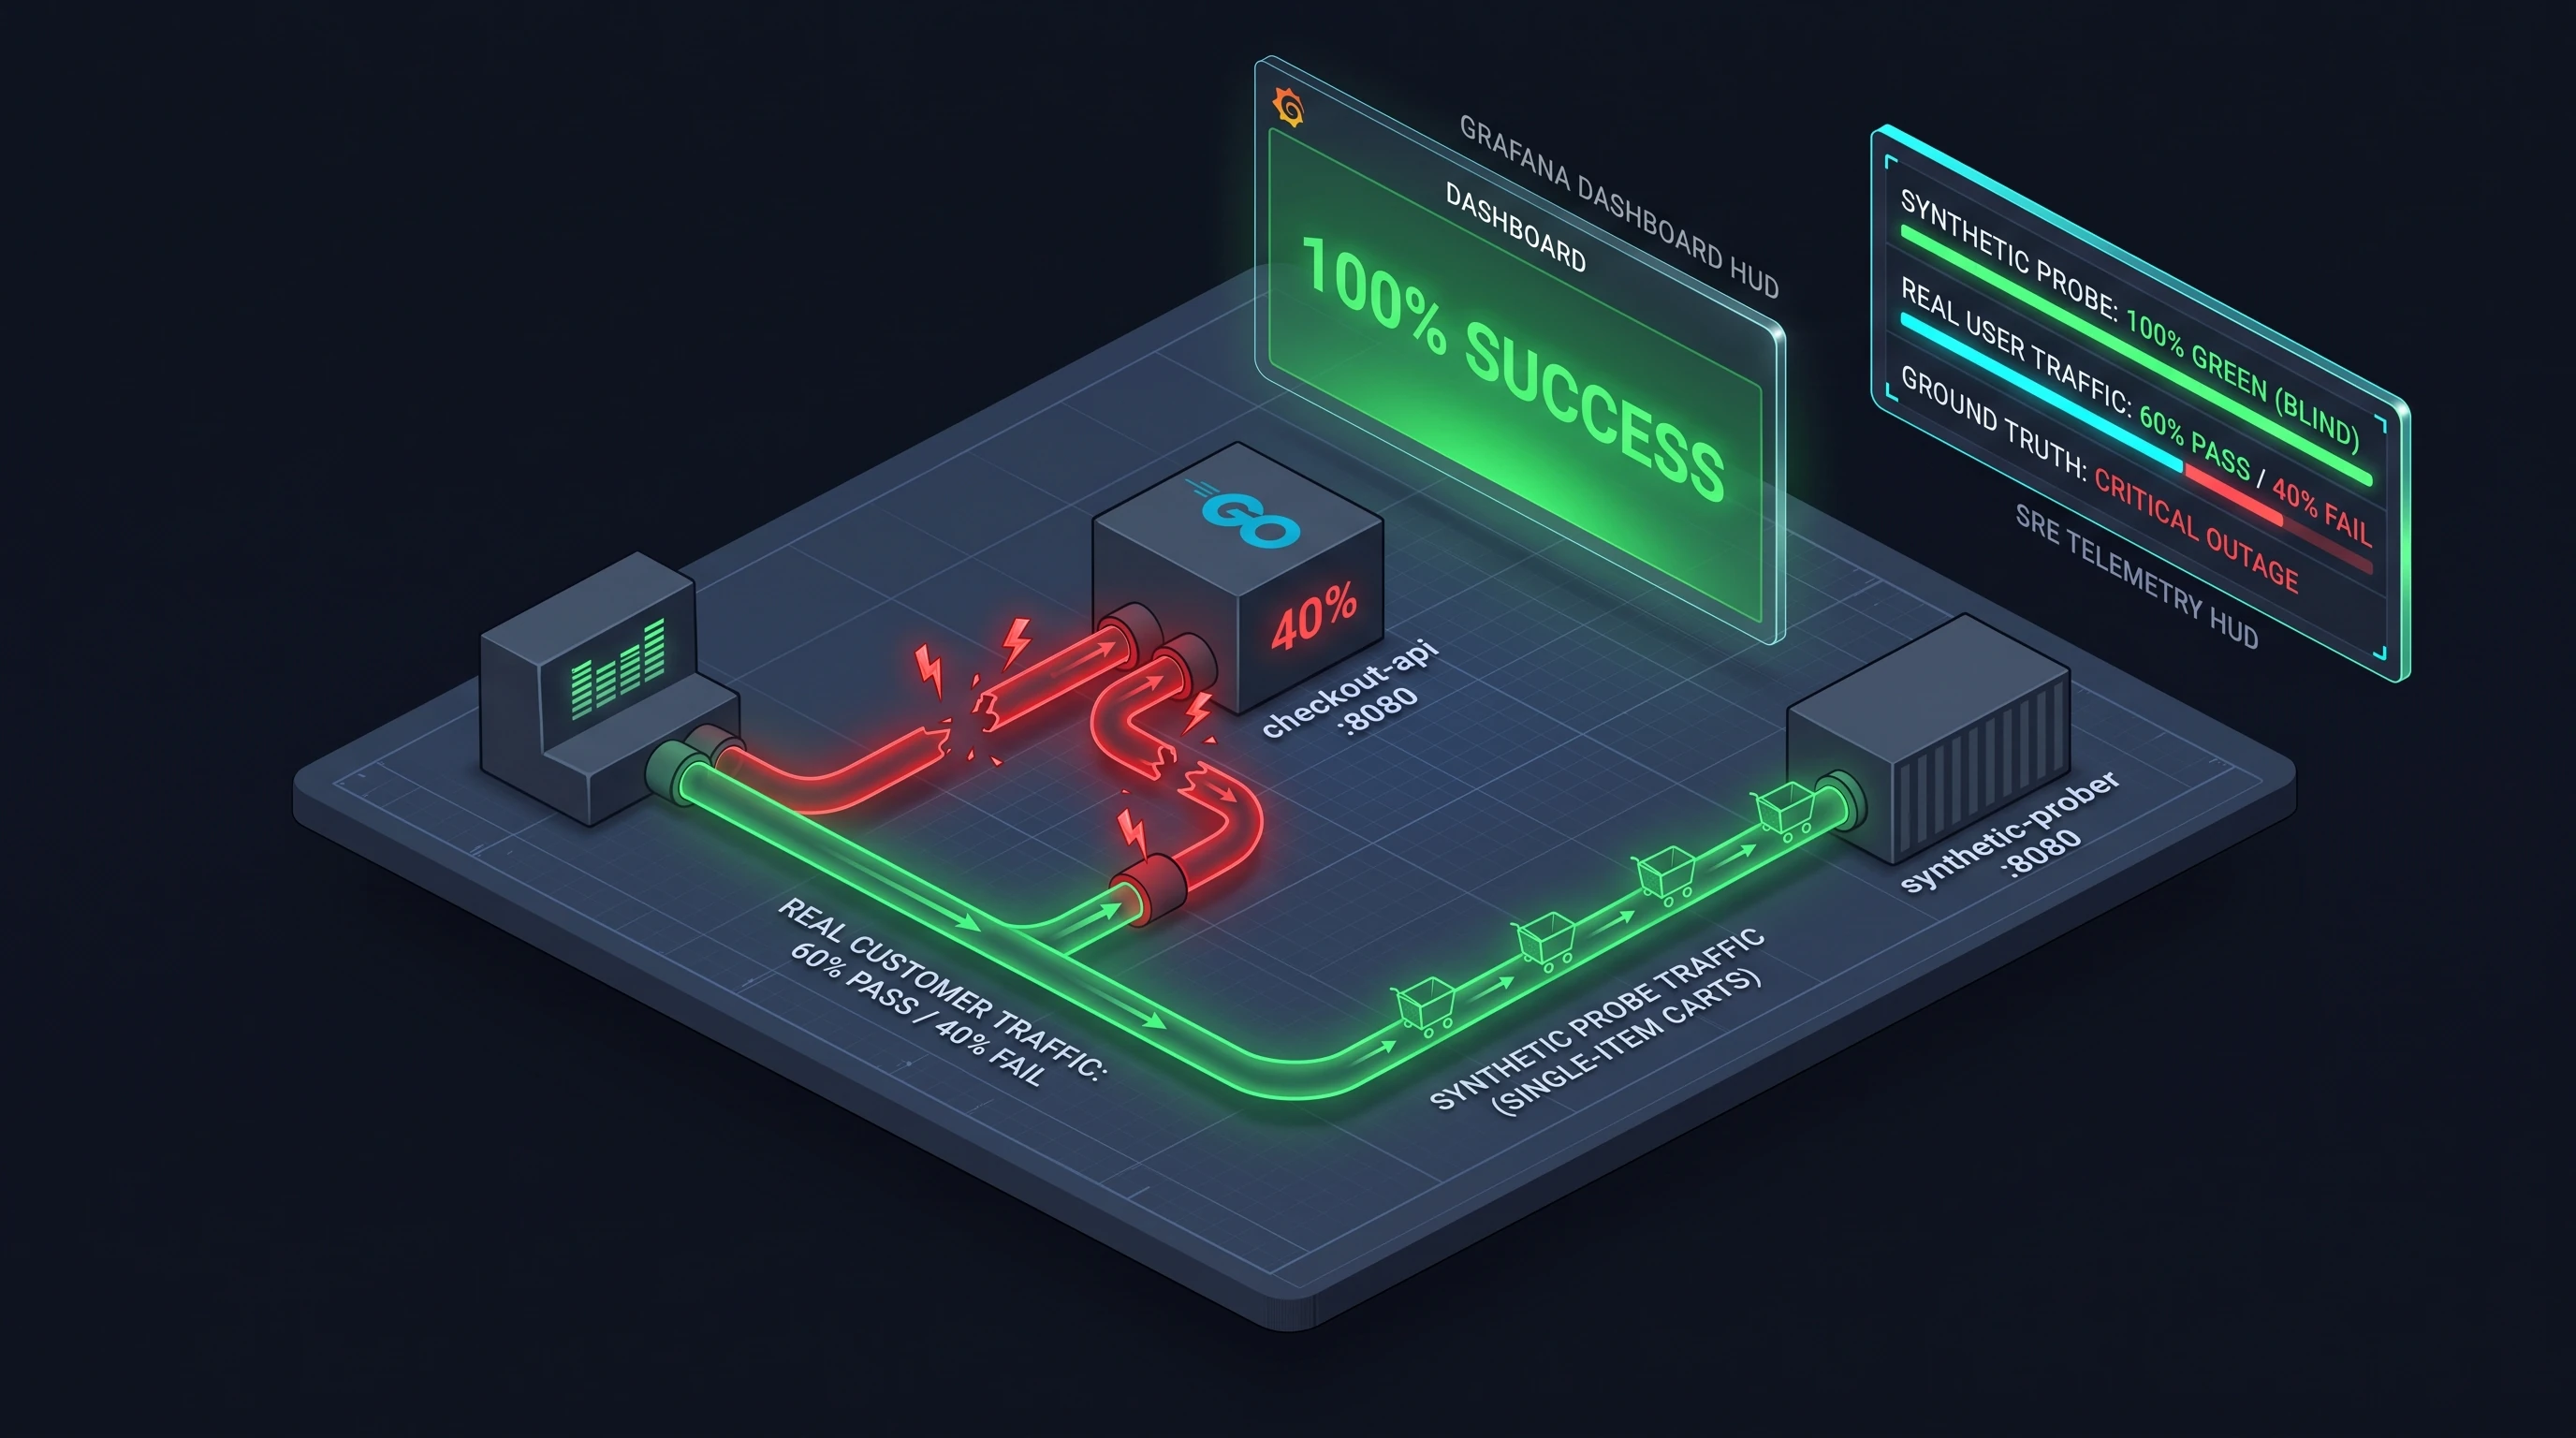
Incident #35 — Dashboards Green, Customers Angry
Support tickets pile up: checkout is failing for real customers, yet all synthetic probers read 100% Green due to an unrevealed payload blindspot. Cross-examine metric streams.
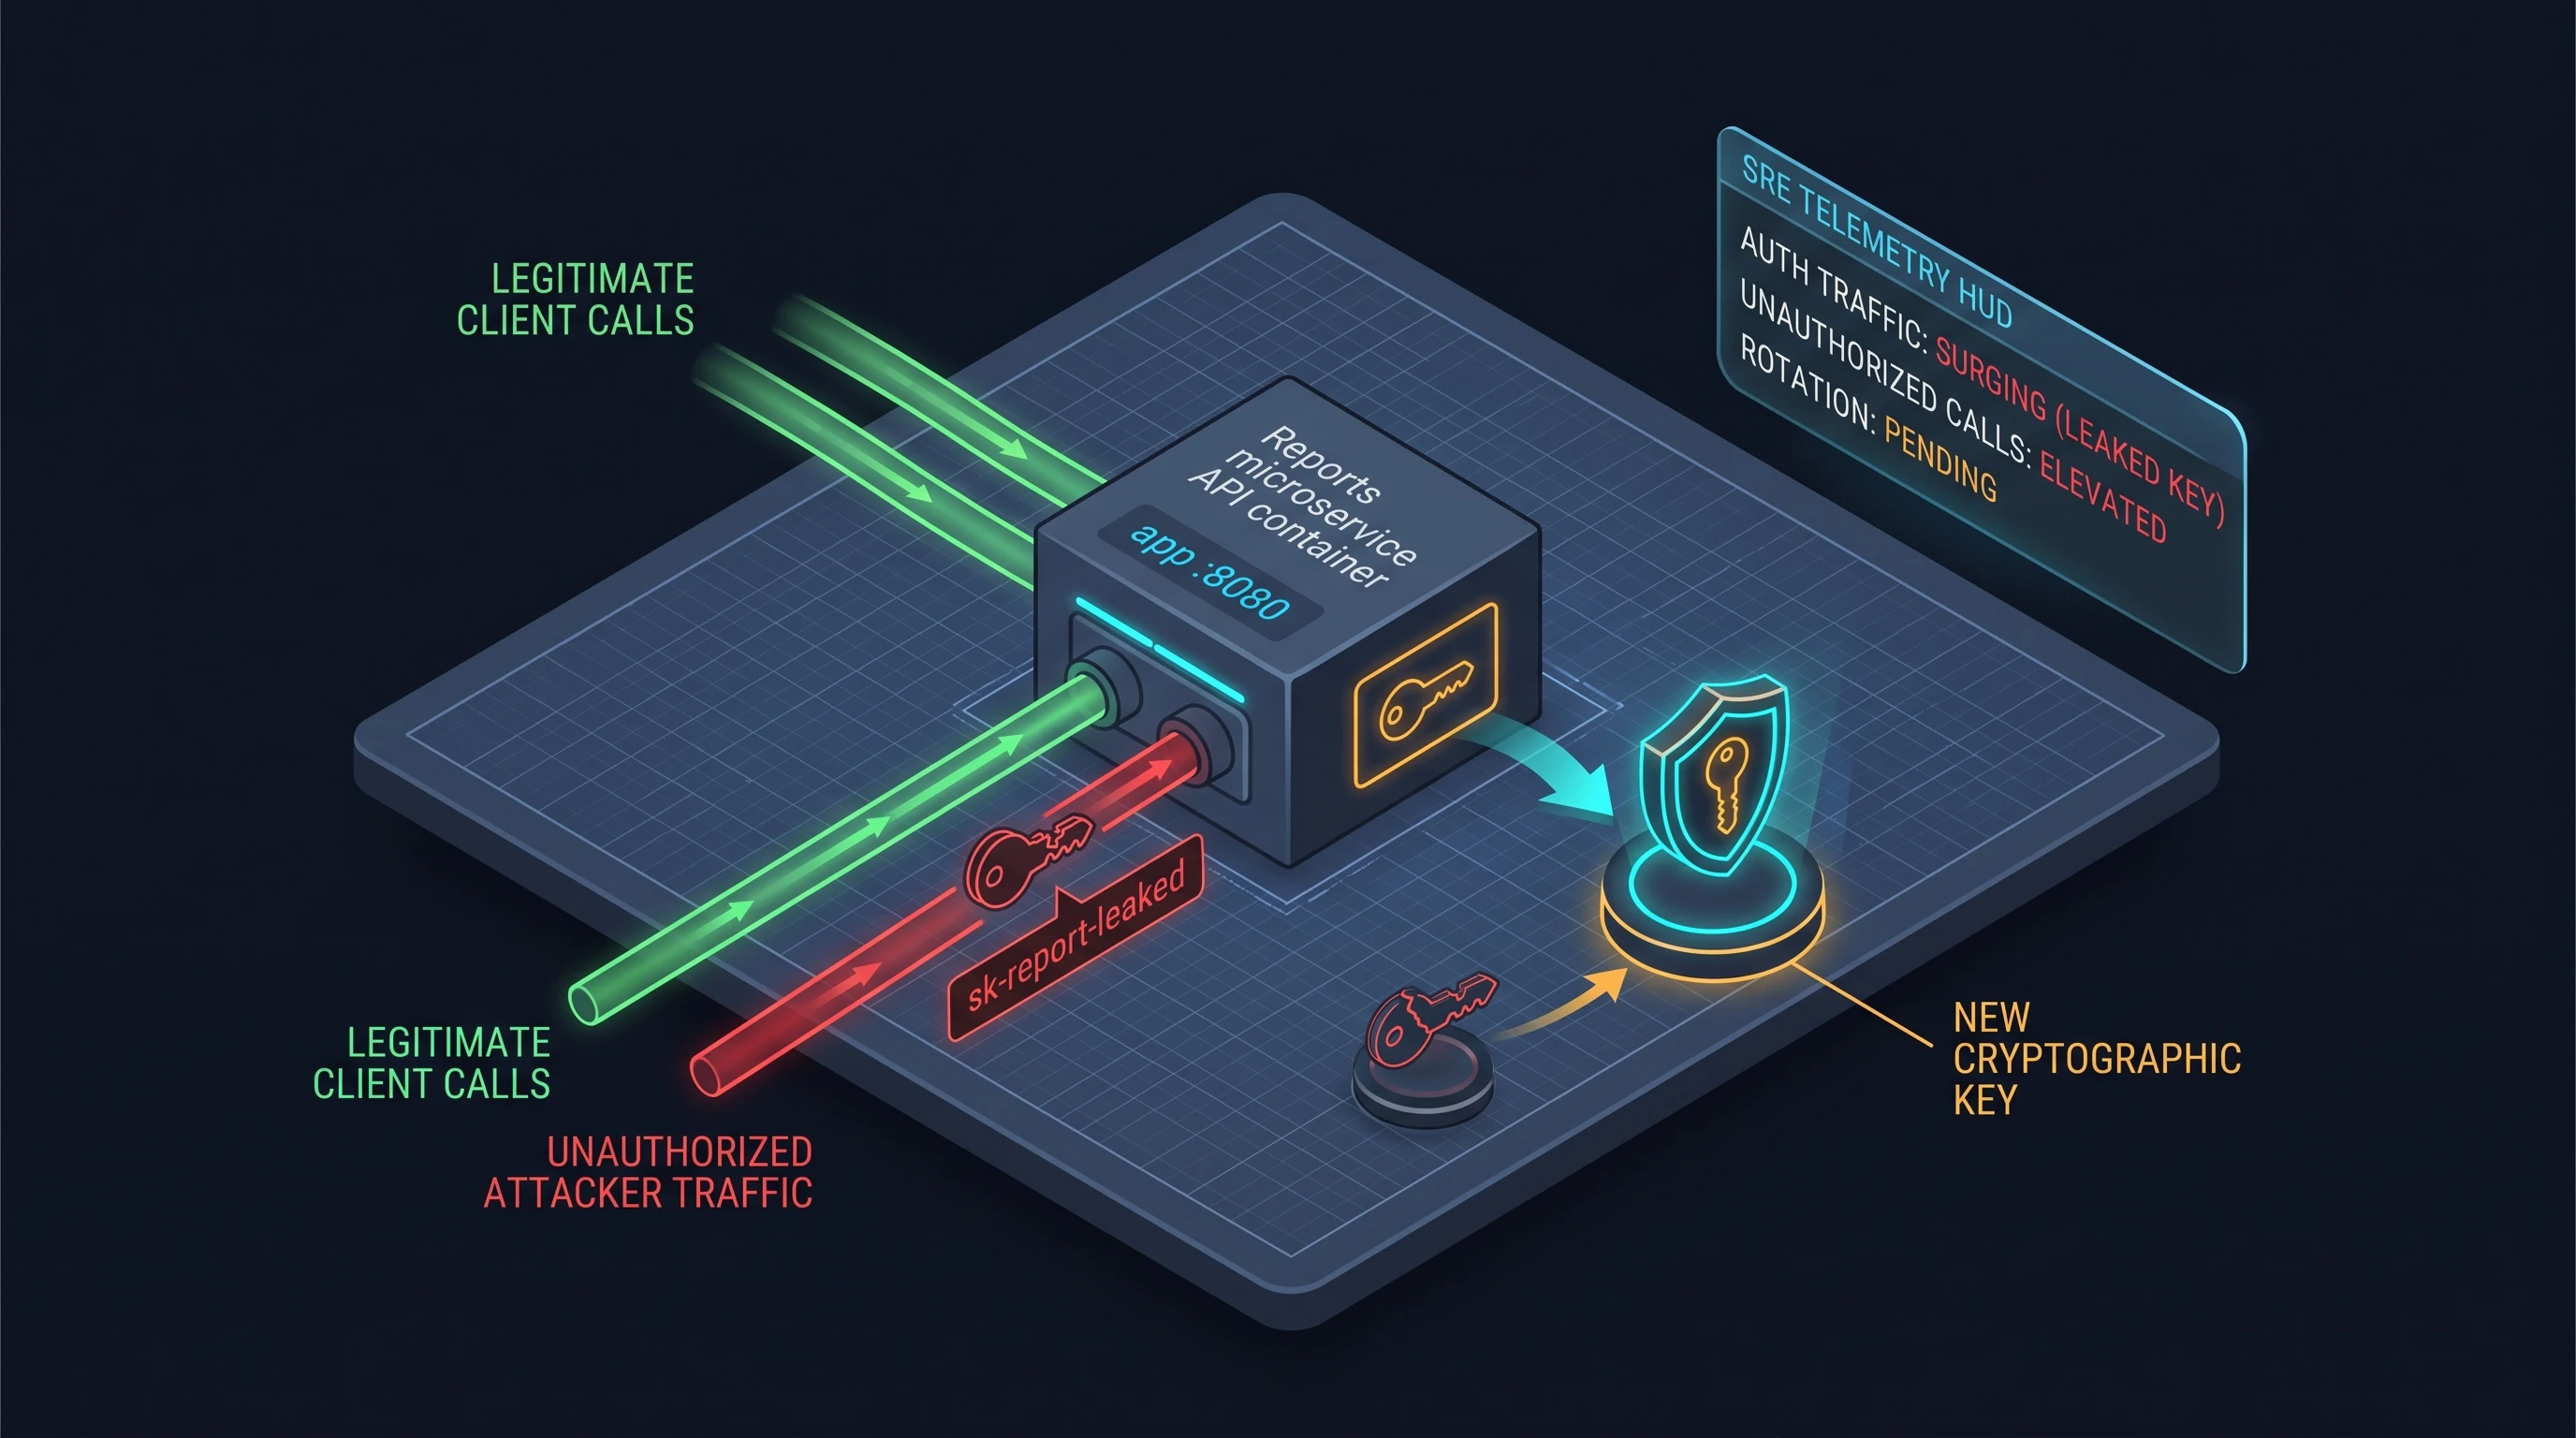
Incident #59 — Leaked Cloud API Key & Security Compromise Triage
A production master API key was accidentally committed to public Git history. Revoke access, quarantine compromised resources, and rotate credentials with zero downtime.
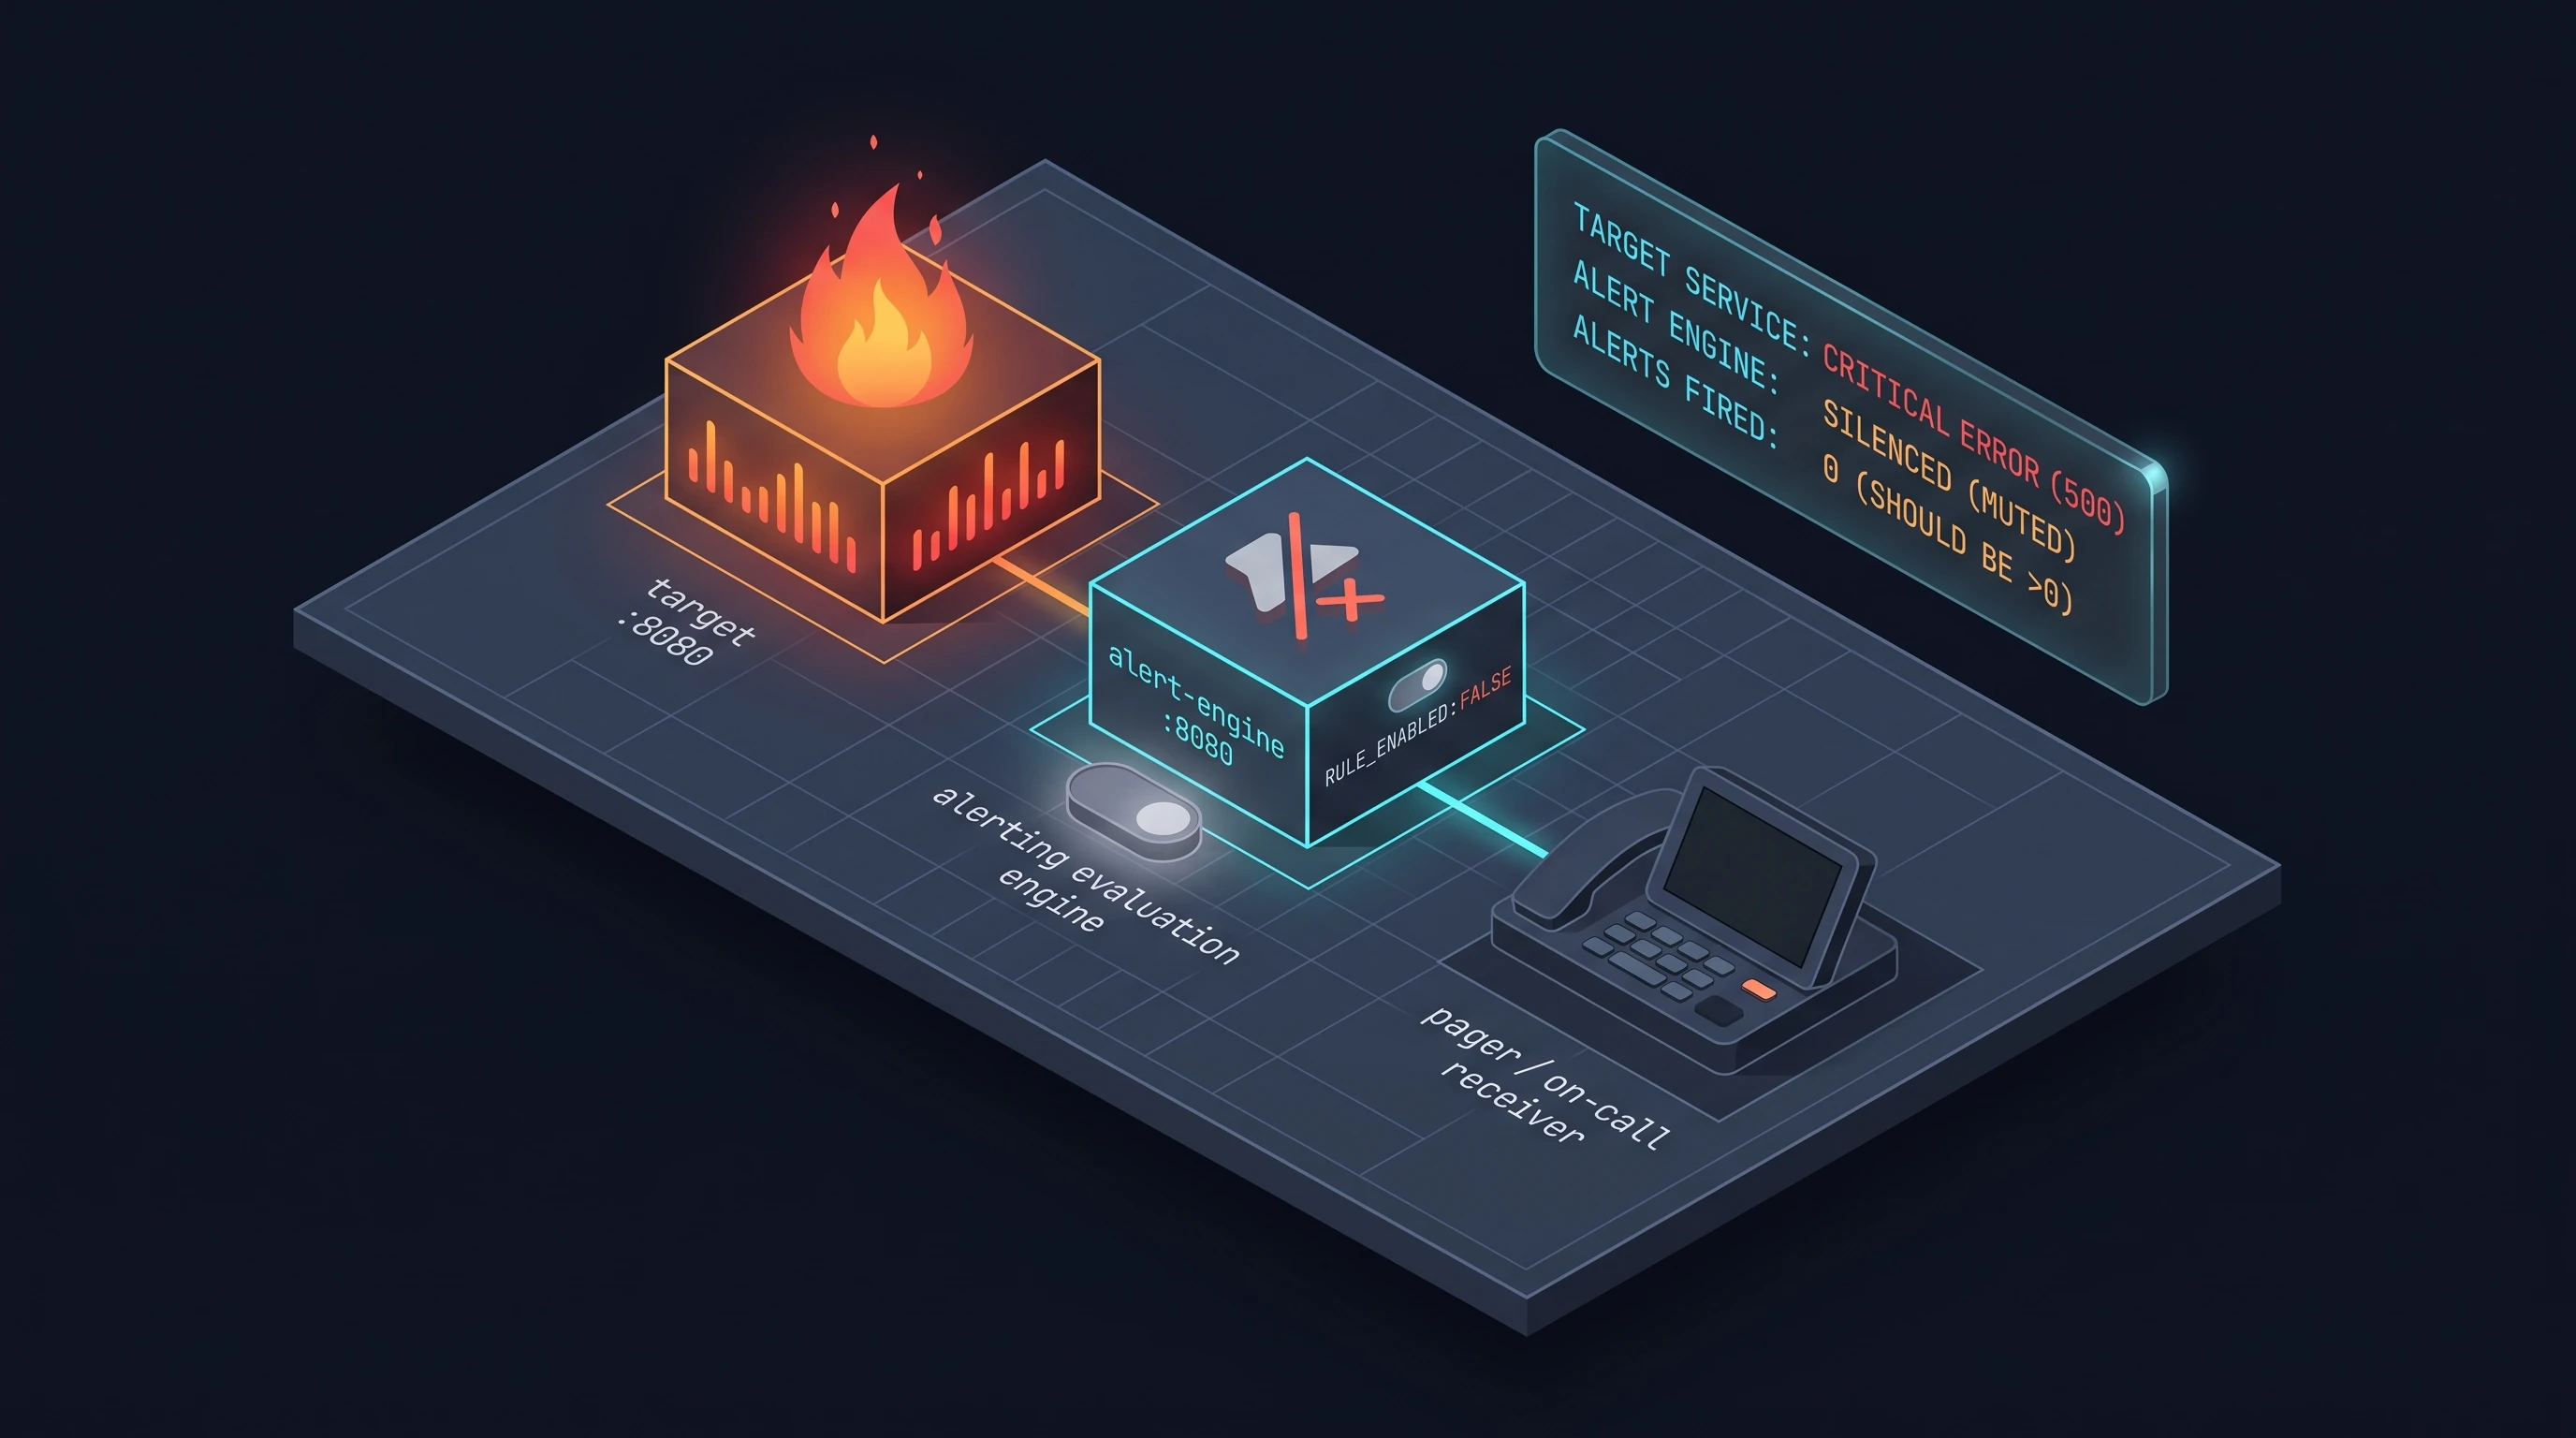
Incident #62 — Prometheus PromQL Silence & Dropped P0 Alert
Production was down for 40 minutes before on-call was alerted because a missing group_left() in a PromQL alert rule caused vector matching to return empty sets.